How Can We Help?
Tip #6: Know your Best-Selling Products in Easy Digital Downloads
Operating an Easy Digital Downloads webstore requires a couple of things to consider, especially if you want to enhance the sales performance of your store. Implementing a good marketing strategy is a must, but are you monitoring and tracking your sales results on a timely basis? How have you implemented a good solution to report and analyze sales data?
After some time, you might be getting a decent number of sales, but do you have any idea which products are being sold the most? Do you know how much your sales revenue is per order? Do you know which are your best-selling products that can be further improved?
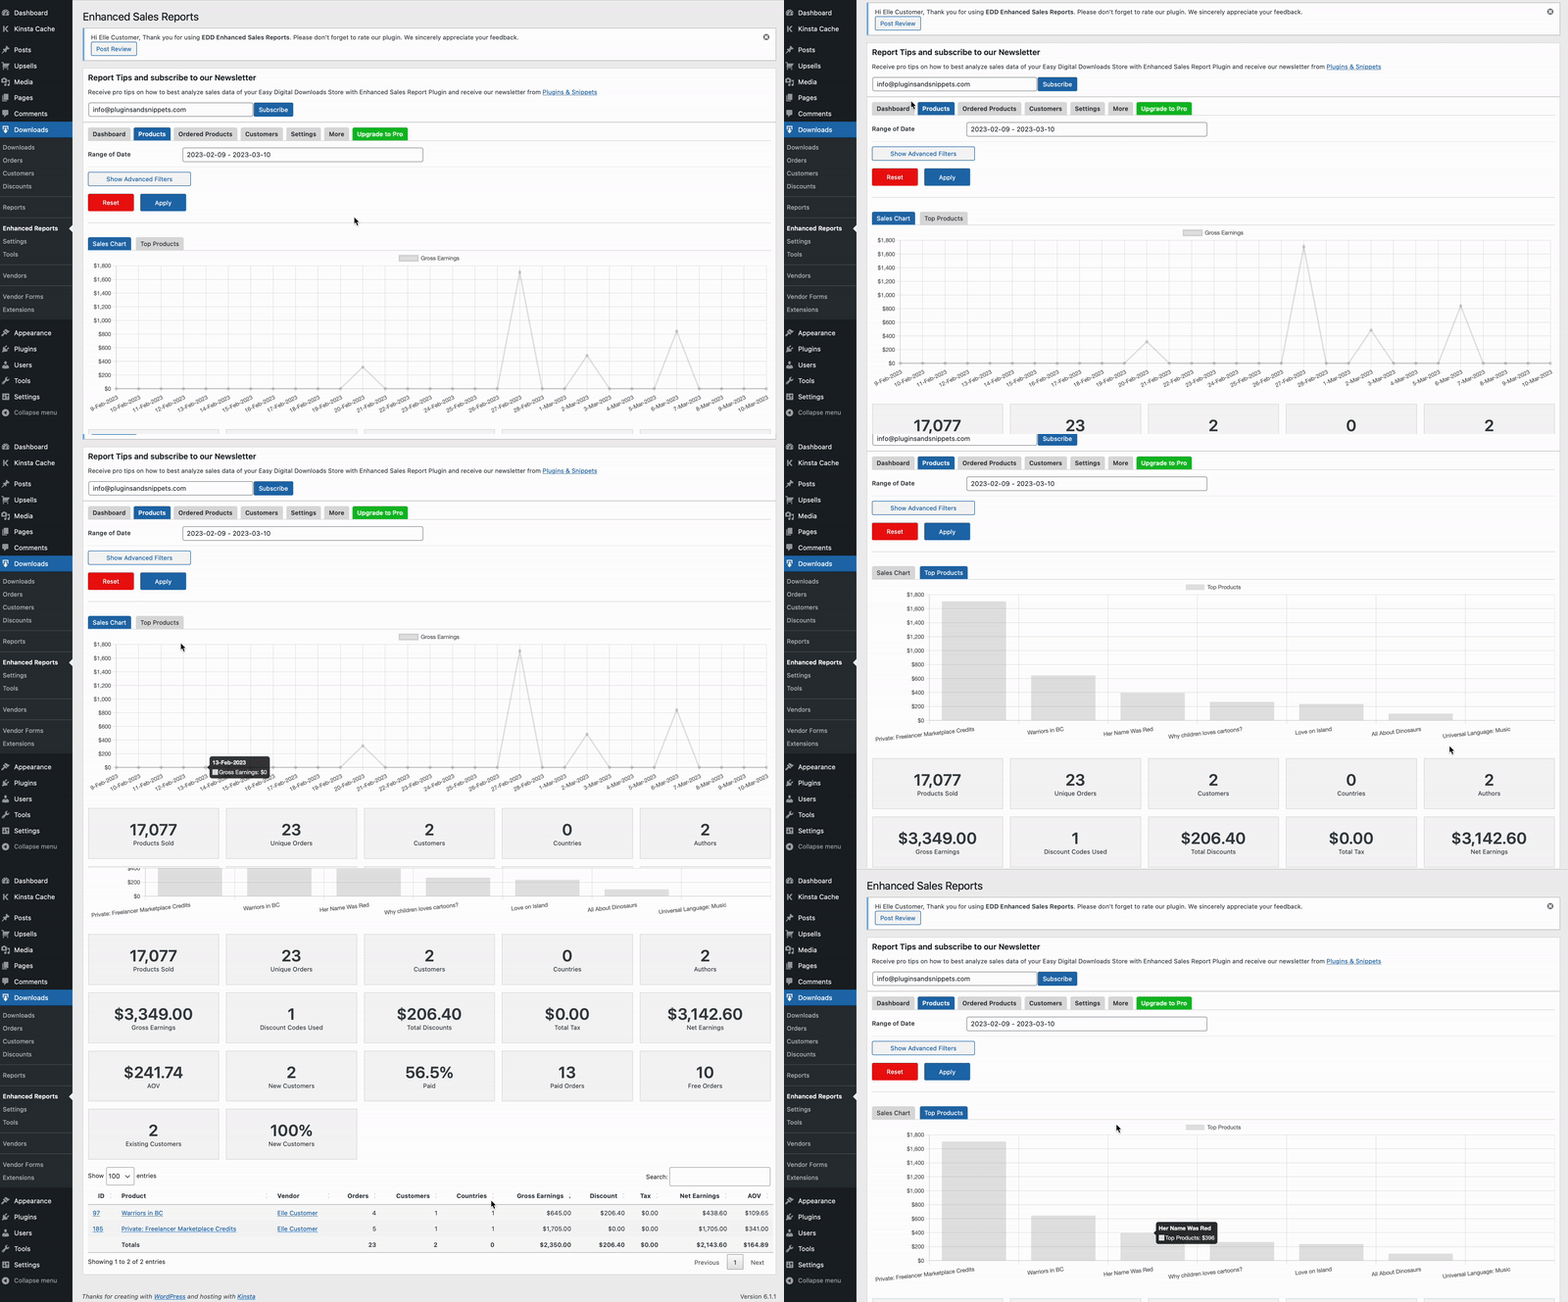
To better analyze sales performance by product, you can use the reports tab in the EDD Enhanced Sales Report Plugin. You can find this report in the tab highlighted below in the Menu Downloads, Enhanced Sales Report [] when the EDD Enhanced Sales Report plugin is active.

Using the Top Products List on the by Product Sales Reports Tab, you can have a chart and list showing the sales performance of your Top Products in your selected time period along with important sales metrics to measure and track.

What you can see in the chart above, is a sales report of the top 10 best-selling product and their earnings as per a selected time period and showing the earnings by product. Please note, there is also a filter menu included below the range of data selectors which allows using more advanced filters and filtering the earnings figures by author, customer, range of average order values, and many more criteria.
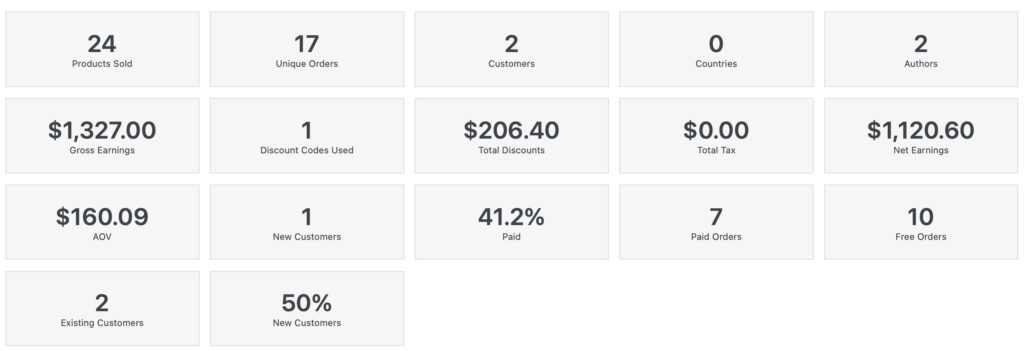
A next important item is to obtain a quick view on your store performance overall. For this please refer to the listed key performance indicators on top of each report page. In the

Also, Key Performance Indicators (KPIs) to measure the sales performance of your webstore, such as:
- Products Sold – no. of products sold within the selected time period
- Unique Orders – no. of orders per unique customer
- Customers – no. of customers who placed their order within the selected time period
- Countries – no. of countries where customers who placed their orders are located
- Authors – no. of product authors whose products are purchased
- Gross Earnings – value of earnings before deducting discounts and taxes
- Discount Codes Used – no. of discount code used in the customer’s orders
- Total Discounts – total value of discounts used from orders within the selected time period
- Total Tax – total value of tax included from orders within the selected time period
- Net Earnings – value of earnings after deducting discounts and taxes
- Average Order Value (AOV) – average order value spent on average for each product sold. Please note that this figure only includes paid products.
- New Customers – no. of new customers who placed an order
- Paid Order Percentage – the percentage of orders which is paid
- Paid Orders – no. of paid orders made
- Free Orders – no. of free orders made
- Existing Customers – no. of customers that placed another order, or basically repurchases
- New Customers Order Percentage – the percentage of orders coming from new customers
Down below the page, we have a table, listing all products that have been purchased in the selected time period, along with other important order details we must know, such as:

- Product Author – indicates the name of the product author which has been purchased
- Orders – no. of orders placed by a customer
- Customers – no. of customers who placed an order for that product
- Countries – no. of countries in which the customer has purchased the product
- Gross Earnings – the value of earning without deducting discounts and taxes incurred
- Tax – the value of tax incurred on the order purchased
- Discount Value – the value of discount used on the order purchased
- Net Earnings – the value of earnings after deducting discounts and taxes incurred
- AOV (Average Order Value) – the average order value per product obtained. Please note, this is especially of relevance if your products include the sale of different versions and you want to figure out what is the average order value for each product. Please also note that the AOV only includes paid orders (excludes the counting of free products downloaded).
Overall, knowing your best-selling products and comparing their sales metrics can lead to important insights into the sales performance of your Easy Digital Downloads Webstore and allows for better reporting. Using the product’s sales report to compare poor performance vs. the benchmark revenue figures of your best-selling products allows you to better identify unused potentials to improve some of your products in order to increase their average order values. Using sales data effectively allows for identifying the reasons why some products are selling better than others and can lead to new ideas on how to create better-selling products. This is especially relevant in the case of selling digital downloadable products which can easier be produced and changed than manufactured products such as those sold in WooCommerce.
Let us know what you think!
If you have a moment, please take a minute and tell us how well did you like EDD Enhanced Sales Reports Plugin by leaving a quick rating on WordPress Plugin Directory.


