
This documentation covers all information required with respect to the EDD Enhanced Sales Report Plugin such as how to install, how it works, and features included.
The EDD Enhanced Sales Report Plugin is a WordPress plugin extension for Easy Digital Downloads eCommerce stores that provide detailed sales and profits reports in order to obtain a better understanding from where sales and profits come from.
Enjoy a lot of features to help filter your store’s sales and profit data according to certain specifications such as filter by product, by customer, by country, by vendor, and many more. This plugin offers you great insights into customer behaviors, market segments, and vendor management. Therefore, this plugin is a recommended add-on to your Easy Digital Downloads store.
How to Install the EDD Enhanced Sales Plugin
In any case that you still don’t have the plugin yet, feel free to purchase it now!
Once you acquire the plugin, you need to manually install it. Open the admin panel of your WordPress website, go to Plugins and choose “Add New”. After that, you will see the screen to the right.

Proceed as follows accordingly:
- Add New Plugin: Firstly upload the plugin either via File Upload (Screenshot above) or via FTP in the plugins WordPress folder.
- Plugins: Then, go to the Installed Plugins page, look for EDD Enhanced Sales Report Plugin and ensure the Plugin is activated.
- Downloads / Reports: Lastly, go to the Downloads menu (which shows up once Easy Digital Downloads Plugin is installed), then click on the submenu Reports and now the “Enhanced Reports” tab will show up.
- Finally, you are ready to go. Check through the Enhanced Sales Reports to enjoy the features provided.
How does the Plugin work?
The plugin has several elements which we will go over in detail for you here:
Tabs
These are several important reports available which allow you to efficiently search through the sales and profit data of your Easy Digital Downloads Store.
- Dashboard
- Report by Product
- Report by Ordered Products
- Report by Orders
- Report by Countries
- Report by States
- Report by Customer
- Report by Vendors
- Report by Subscriptions
- Settings
- License
The reports aim to provide you with important insights from where the sales and profits come from. Generally, the important questions to be answered are the following: Which countries do you sell best to? What are the best products to sell to by each country? From which vendors can you make most profits? How do sales compare to the previous month or the previous year? Which products are sold to which states (e.g. relevant for the US)? Also, which customers show the highest ARPU? etc.
Dashboard
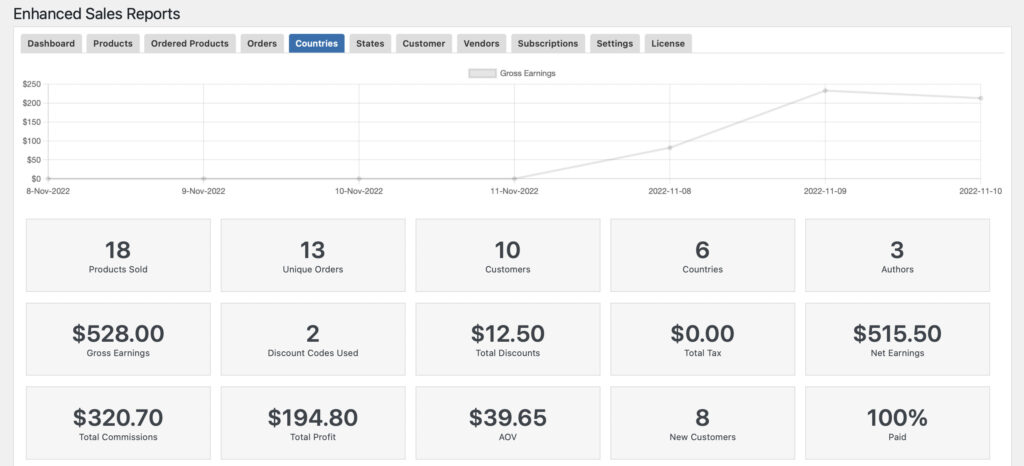
The Dashboard summarizes everything you need to quickly check and monitor related to your Sales Revenue Flow.
Here we have a Gross Earnings Chart which shows you the trend of sales revenues from the given time period.
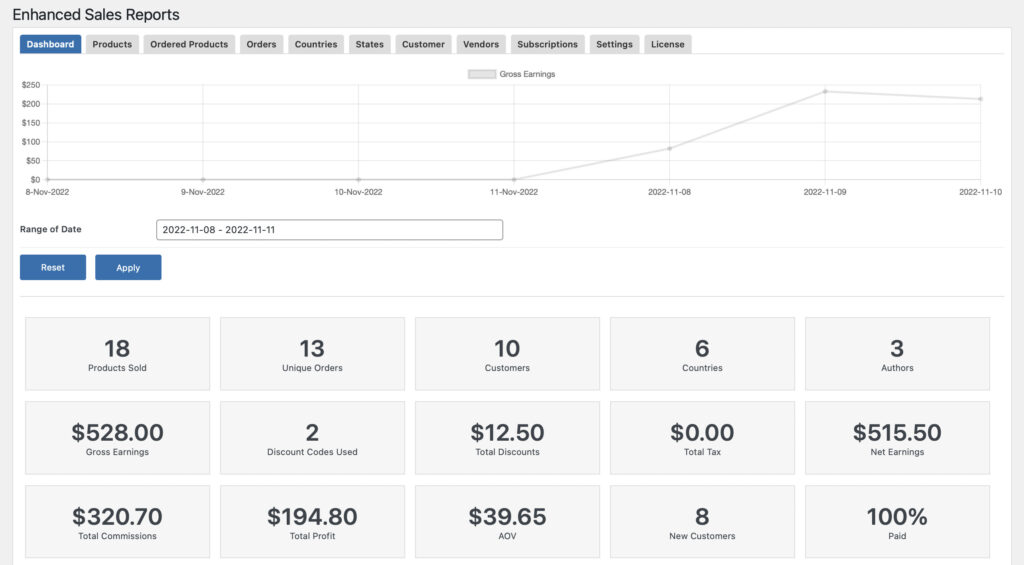
Also included in the dashboard are the important KPIs such as:
- Products Sold: Refers to the total number of products sold within the given time period.
- Unique Orders: Refers to the total number of unique orders made within the given time frame.
- Customers: Refers to the total number of customers transacted within your webstore.
- Countries: Refers to the total number of countries in which your customers can from.
- Authors: Refers to the total number of product authors of which their product is purchased by a customer.
- Gross Earnings: Refers to the revenues for each product made during the selected time period.
- Discount Codes Used: Refers to the total number of discount codes used by the customer when purchasing your products.
- Total Discounts: Refers to the total amount of discounts used by the customers.
- Total Tax: Refers to the total amount of tax accumulated and paid by customers.
- Net Earnings: Refers to the net earnings, less discounts, tax and commissions, for each product made during the selected time period.
- Total Commission: Refers to the total amount of vendor/author commissions accumulated during a customer purchase.
- Total Profit: Refers to the total amount of profits from a customer purchase.
- AOV: Refers to the average dollar amount spent each time a customer places an order on a website or mobile app.
- New Customers: Refers to the total number of new customers registered during the given time period.
- Paid: Refers to the percentage of customer orders that has been successfully paid by customers during checkout.
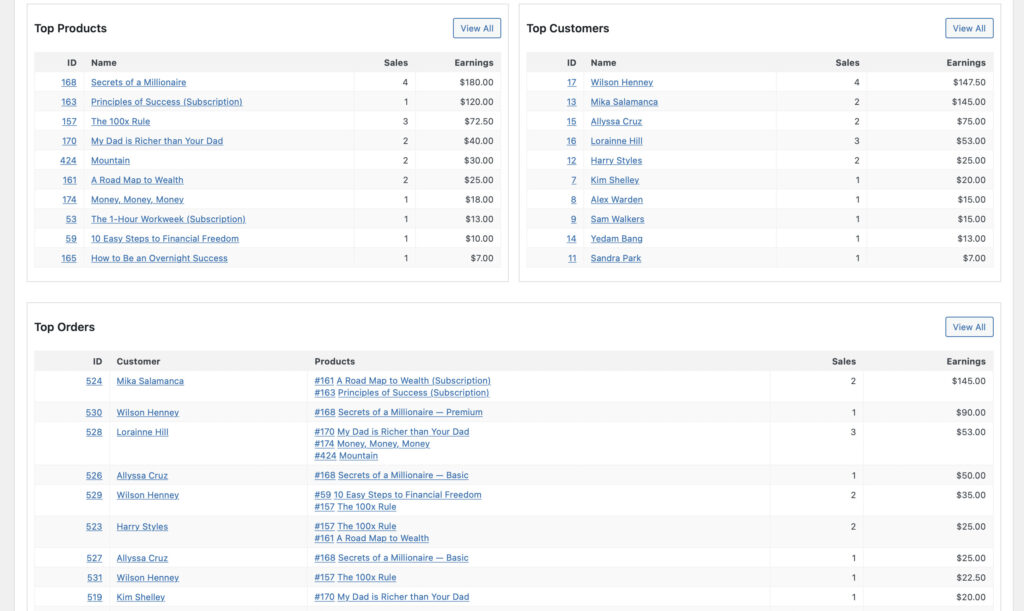
We also list down the following vital information that site admins will love to review and monitor, such as:
- Top Products
- Top Customers
- Top Orders
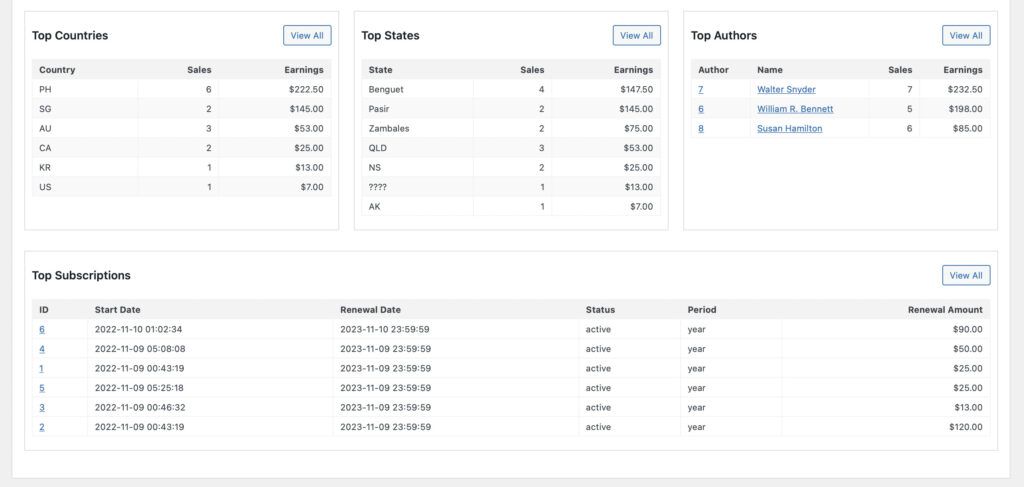
- Top Countries
- Top States
- Top Authors
- Top Subscriptions
Report By Product
The first kind of report is the report by product. Here, it summarizes the sales and profits per product for the selected time period and search filters.
Here we have a Gross Earnings Chart which shows you the trend of sales revenues from the given time period.
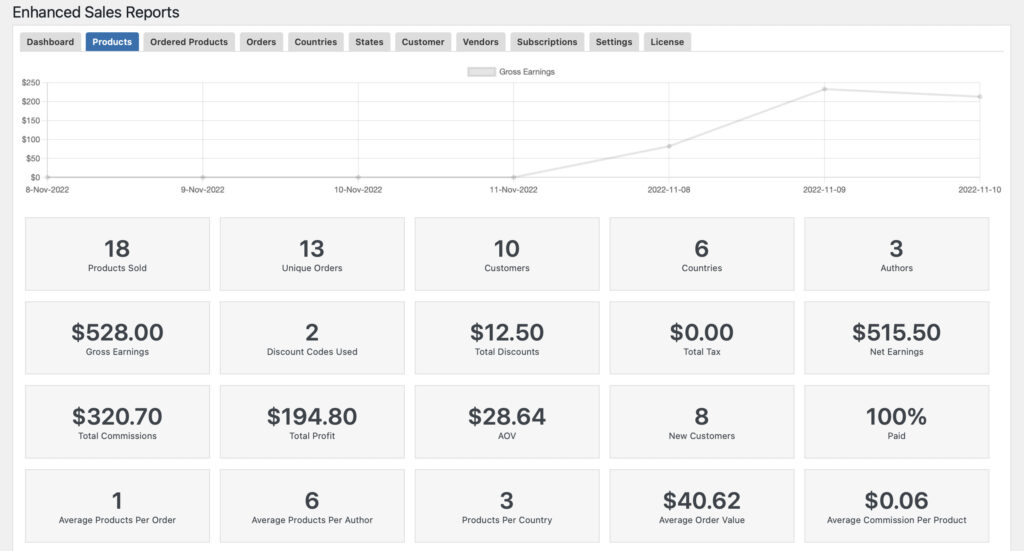
Also included in the dashboard are the important KPIs such as:
- Products Sold: Refers to the total number of products sold within the given time period.
- Unique Orders: Refers to the total number of unique orders made within the given time frame.
- Customers: Refers to the total number of customers transacted within your webstore.
- Countries: Refers to the total number of countries in which your customers can from.
- Authors: Refers to the total number of product authors of which their product is purchased by a customer.
- Gross Earnings: Refers to the revenues for each product made during the selected time period.
- Discount Codes Used: Refers to the total number of discount codes used by the customer when purchasing your products.
- Total Discounts: Refers to the total amount of discounts used by the customers.
- Total Tax: Refers to the total amount of tax accumulated and paid by customers.
- Net Earnings: Refers to the net earnings, less discounts, tax and commissions, for each product made during the selected time period.
- Total Commission: Refers to the total amount of vendor/author commissions accumulated during a customer purchase.
- Total Profit: Refers to the total amount of profits from a customer purchase.
- AOV: Refers to the average dollar amount spent each time a customer places an order on a website or mobile app.
- New Customers #: Refers to the total number of new customers registered during the given time period.
- Paid: Refers to the percentage of customer orders that has been successfully paid by customers during checkout.
- Average Products Per Order: Refers to the average number of products being purchased per customer order.
- Average Products Per Author: Refers to the average number of products being purchased per author.
- Products Per Country: Refers to the average number of products being purchased per customer country.
- Average Order Value: Refers to the average dollar amount spent each time a customer places an order on a website or mobile app.
- Average Commission Per Product: Refers to the average amount of vendor/author commissions accumulated per product order.
- Average Order Profit: Refers to the average number of profit accumulated per customer order.
- Paid Orders: Refers to the total number of paid orders during the given time period.
- Free Orders: Refers to the total number of free orders during the given time period.
- Existing Customers: Refers to the total number of existing customers during the given time period.
- New Customers %: Refers to the total percentage of new customers who registered during the given time period.
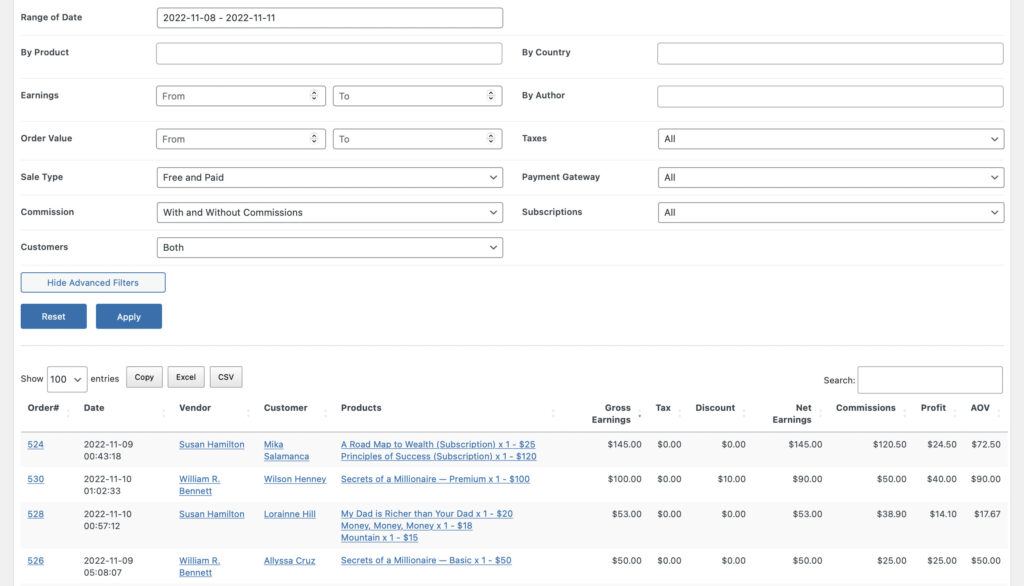
We also have comprehensive filter section which allow you to filter the reports by:
- Range of Date
- By Product
- By Country
- Earnings
- By Author
- Order Value
- Taxes – with our without
- Sales Type – Free, Paid or Free and Paid
- Type of Payment Gateway
- Subscriptions
- Customers
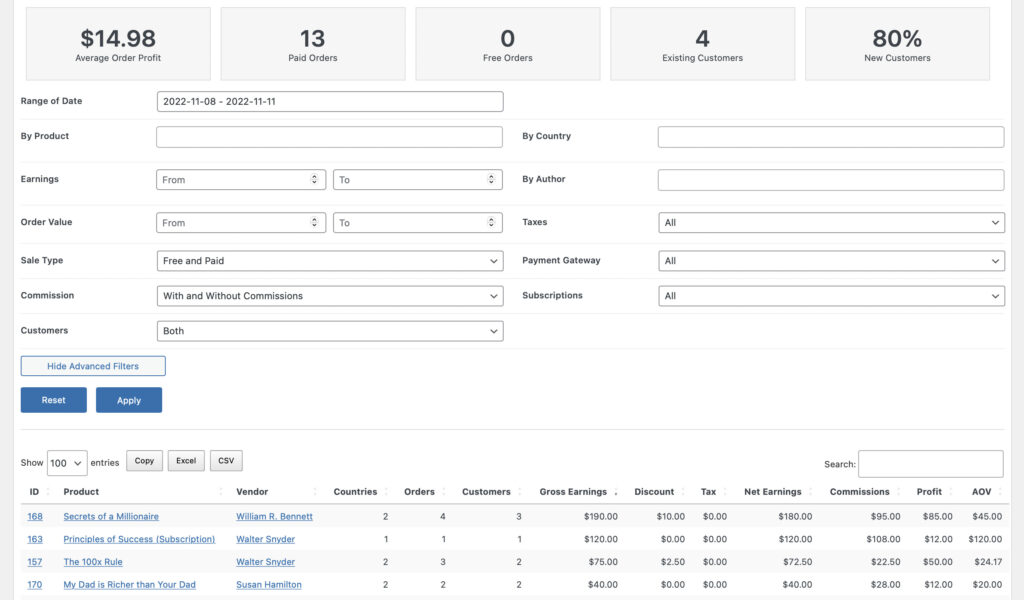
Then lastly, down below the page you will see a list of all orders per product, including some information related to that specific order.
Report By Ordered Products
The second report is the report by ordered products. Here, it summarizes the sales and profits per ordered products for the selected time period and search filters.
Here we have a Gross Earnings Chart which shows you the trend of sales revenues from the given time period.
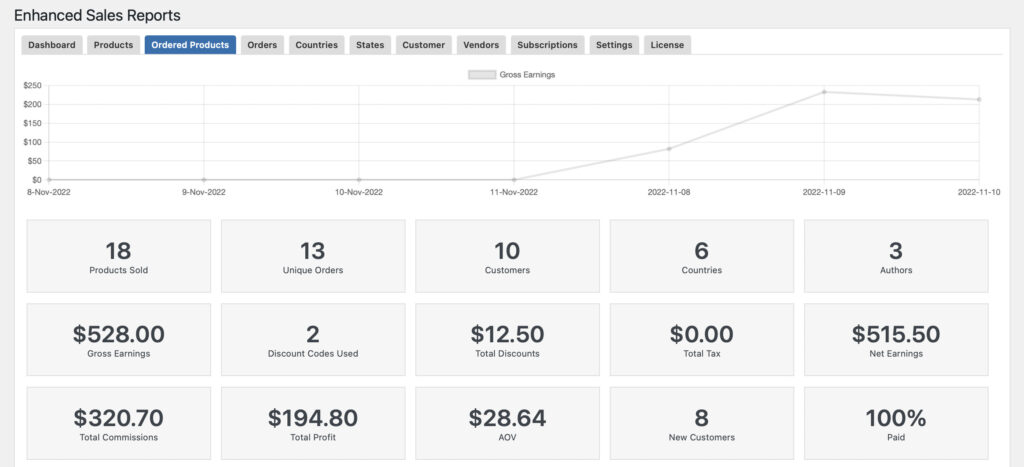
Also included in the dashboard are the important KPIs such as:
- Products Sold: Refers to the total number of products sold within the given time period.
- Unique Orders: Refers to the total number of unique orders made within the given time frame.
- Customers: Refers to the total number of customers transacted within your webstore.
- Countries: Refers to the total number of countries in which your customers can from.
- Authors: Refers to the total number of product authors of which their product is purchased by a customer.
- Gross Earnings: Refers to the revenues for each product made during the selected time period.
- Discount Codes Used: Refers to the total number of discount codes used by the customer when purchasing your products.
- Total Discounts: Refers to the total amount of discounts used by the customers.
- Total Tax: Refers to the total amount of tax accumulated and paid by customers.
- Net Earnings: Refers to the net earnings, less discounts, tax and commissions, for each product made during the selected time period.
- Total Commission: Refers to the total amount of vendor/author commissions accumulated during a customer purchase.
- Total Profit: Refers to the total amount of profits from a customer purchase.
- AOV: Refers to the average dollar amount spent each time a customer places an order on a website or mobile app.
- New Customers #: Refers to the total number of new customers registered during the given time period.
- Paid: Refers to the percentage of customer orders that has been successfully paid by customers during checkout.
We also have comprehensive filter section which allow you to filter the reports by:
- Range of Date
- By Product
- By Country
- Earnings
- By Author
- Order Value
- Taxes – with our without
- Sales Type – Free, Paid or Free and Paid
- Type of Payment Gateway
- Subscriptions
- Customers
Then lastly, down below the page you will see a list of all orders per product, including some information related to that specific order.
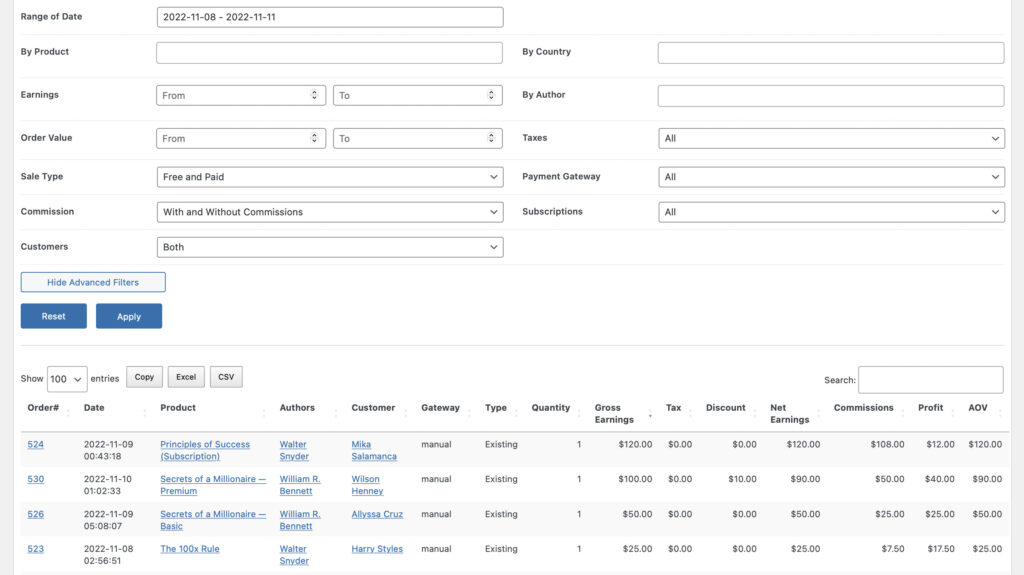
Report By Orders
The third report is the report by orders. Here, it summarizes the sales and profits per order for the selected time period and search filters.
Here we have a Gross Earnings Chart which shows you the trend of sales revenues from the given time period.
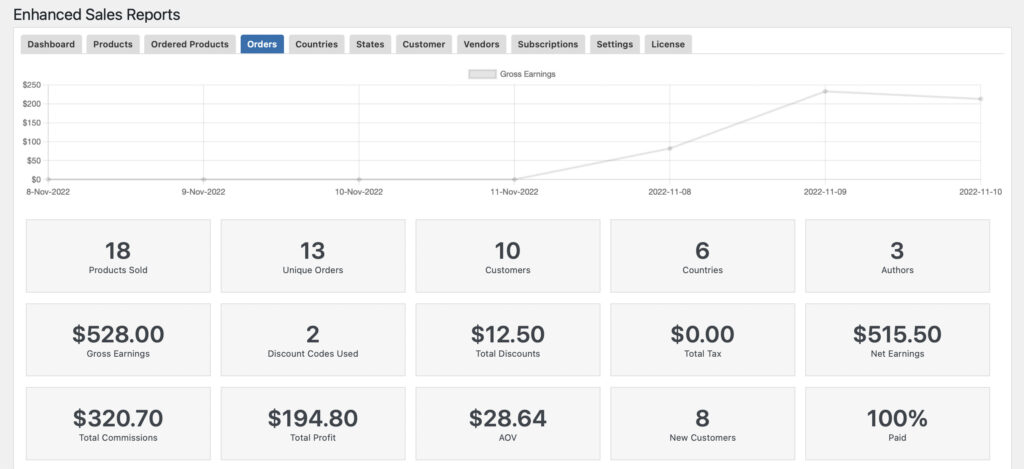
Also included in the dashboard are the important KPIs such as:
- Products Sold: Refers to the total number of products sold within the given time period.
- Unique Orders: Refers to the total number of unique orders made within the given time frame.
- Customers: Refers to the total number of customers transacted within your webstore.
- Countries: Refers to the total number of countries in which your customers can from.
- Authors: Refers to the total number of product authors of which their product is purchased by a customer.
- Gross Earnings: Refers to the revenues for each product made during the selected time period.
- Discount Codes Used: Refers to the total number of discount codes used by the customer when purchasing your products.
- Total Discounts: Refers to the total amount of discounts used by the customers.
- Total Tax: Refers to the total amount of tax accumulated and paid by customers.
- Net Earnings: Refers to the net earnings, less discounts, tax and commissions, for each product made during the selected time period.
- Total Commission: Refers to the total amount of vendor/author commissions accumulated during a customer purchase.
- Total Profit: Refers to the total amount of profits from a customer purchase.
- AOV: Refers to the average dollar amount spent each time a customer places an order on a website or mobile app.
- New Customers #: Refers to the total number of new customers registered during the given time period.
- Paid: Refers to the percentage of customer orders that has been successfully paid by customers during checkout.
We also have comprehensive filter section which allow you to filter the reports by:
- Range of Date
- By Product
- By Country
- Earnings
- By Author
- Order Value
- Taxes – with our without
- Sales Type – Free, Paid or Free and Paid
- Type of Payment Gateway
- Subscriptions
- Customers
Then lastly, down below the page you will see a list of all orders, including some information related to that specific order.
Report By Countries
The fourth report is the report by countries. Here, it summarizes the sales and profits per country from which the customer had made the purchase, in the selected time period and search filters.
Here we have a Gross Earnings Chart which shows you the trend of sales revenues from the given time period.
Also included in the dashboard are the important KPIs such as:
- Products Sold: Refers to the total number of products sold within the given time period.
- Unique Orders: Refers to the total number of unique orders made within the given time frame.
- Customers: Refers to the total number of customers transacted within your webstore.
- Countries: Refers to the total number of countries in which your customers can from.
- Authors: Refers to the total number of product authors of which their product is purchased by a customer.
- Gross Earnings: Refers to the revenues for each product made during the selected time period.
- Discount Codes Used: Refers to the total number of discount codes used by the customer when purchasing your products.
- Total Discounts: Refers to the total amount of discounts used by the customers.
- Total Tax: Refers to the total amount of tax accumulated and paid by customers.
- Net Earnings: Refers to the net earnings, less discounts, tax and commissions, for each product made during the selected time period.
- Total Commission: Refers to the total amount of vendor/author commissions accumulated during a customer purchase.
- Total Profit: Refers to the total amount of profits from a customer purchase.
- AOV: Refers to the average dollar amount spent each time a customer places an order on a website or mobile app.
- New Customers #: Refers to the total number of new customers registered during the given time period.
- Paid: Refers to the percentage of customer orders that has been successfully paid by customers during checkout.
We also have comprehensive filter section which allow you to filter the reports by:
- Range of Date
- By Product
- By Country
- Earnings
- By Author
- Order Value
- Taxes – with our without
- Sales Type – Free, Paid or Free and Paid
- Type of Payment Gateway
- Subscriptions
- Customers
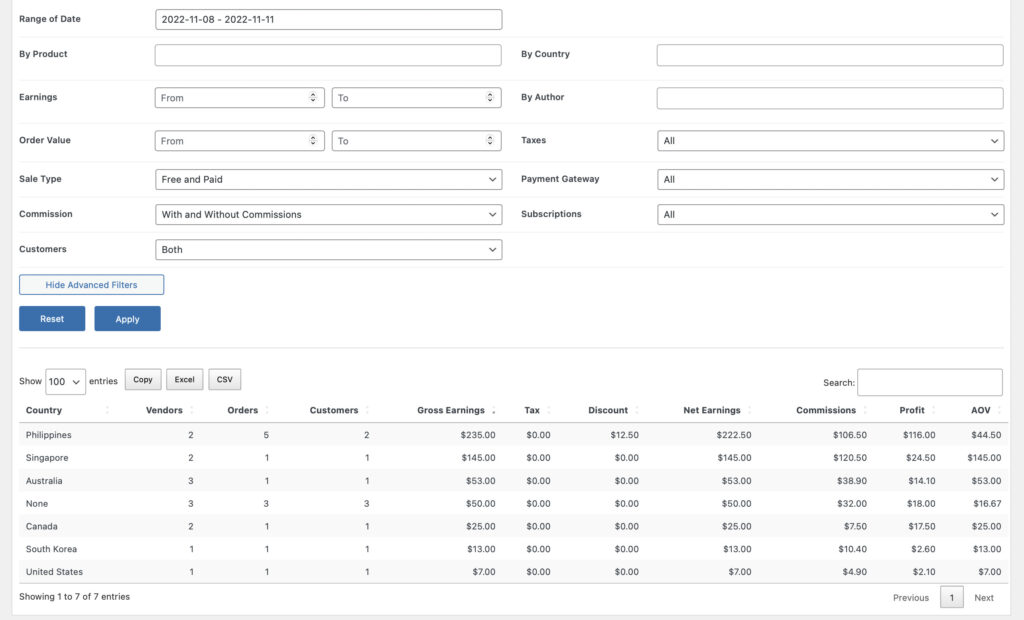
Then lastly, down below the page you will see a list of all orders per country, including some sales information related to that country.
Report By States
The fifth report is the report by states. Here, it summarizes the sales and profits per states from which the customer had made the purchase, in the selected time period and search filters.
Here we have a Gross Earnings Chart which shows you the trend of sales revenues from the given time period.
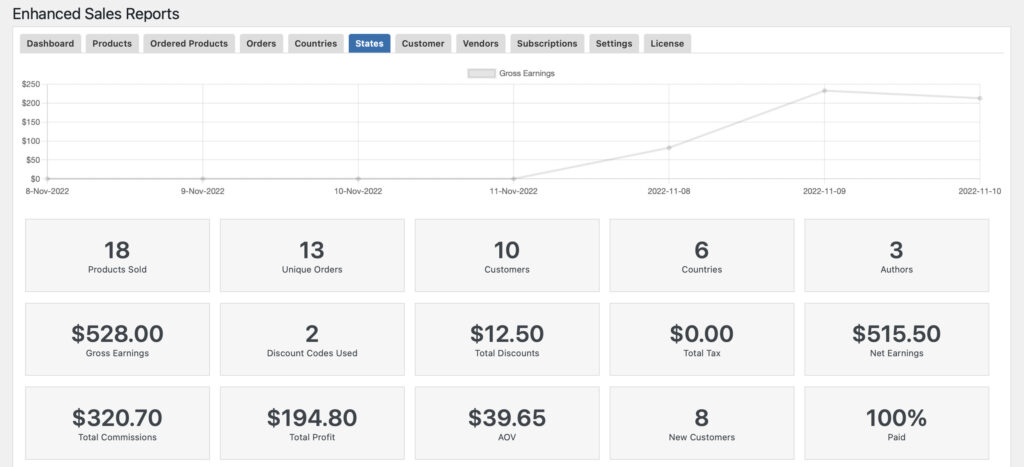
Also included in the dashboard are the important KPIs such as:
- Products Sold: Refers to the total number of products sold within the given time period.
- Unique Orders: Refers to the total number of unique orders made within the given time frame.
- Customers: Refers to the total number of customers transacted within your webstore.
- Countries: Refers to the total number of countries in which your customers can from.
- Authors: Refers to the total number of product authors of which their product is purchased by a customer.
- Gross Earnings: Refers to the revenues for each product made during the selected time period.
- Discount Codes Used: Refers to the total number of discount codes used by the customer when purchasing your products.
- Total Discounts: Refers to the total amount of discounts used by the customers.
- Total Tax: Refers to the total amount of tax accumulated and paid by customers.
- Net Earnings: Refers to the net earnings, less discounts, tax and commissions, for each product made during the selected time period.
- Total Commission: Refers to the total amount of vendor/author commissions accumulated during a customer purchase.
- Total Profit: Refers to the total amount of profits from a customer purchase.
- AOV: Refers to the average dollar amount spent each time a customer places an order on a website or mobile app.
- New Customers #: Refers to the total number of new customers registered during the given time period.
- Paid: Refers to the percentage of customer orders that has been successfully paid by customers during checkout.
We also have comprehensive filter section which allow you to filter the reports by:
- Range of Date
- By Product
- By Country
- Earnings
- By Author
- Order Value
- Taxes – with our without
- Sales Type – Free, Paid or Free and Paid
- Type of Payment Gateway
- Subscriptions
- Customers
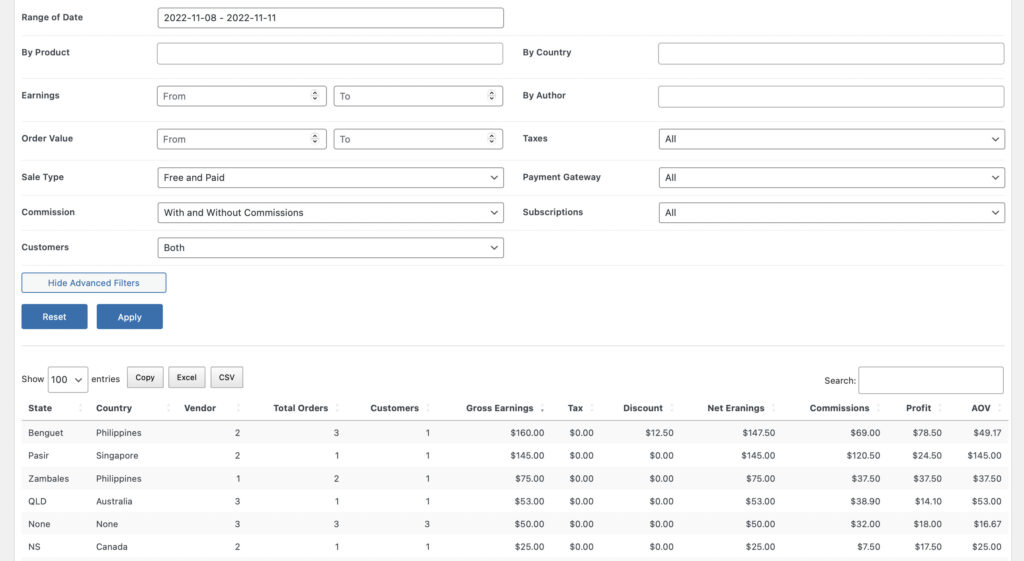
Then lastly, down below the page you will see a list of all orders per states, including some sales information related to that state.
Report By Customer
The sixth report is the report by customer. Here, it summarizes the sales and profits per customer who transacted to your webstore, for the selected time period and search filters.
Here we have a Gross Earnings Chart which shows you the trend of sales revenues from the given time period.
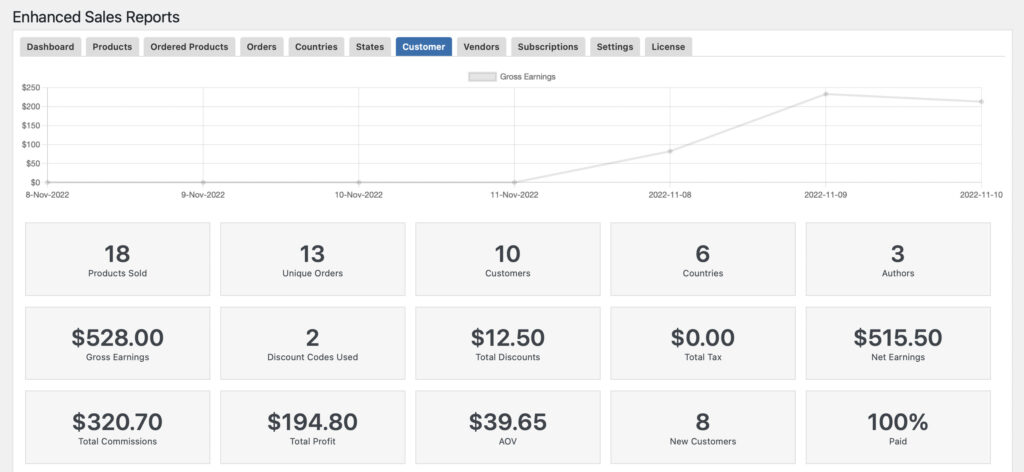
Also included in the dashboard are the important KPIs such as:
- Products Sold: Refers to the total number of products sold within the given time period.
- Unique Orders: Refers to the total number of unique orders made within the given time frame.
- Customers: Refers to the total number of customers transacted within your webstore.
- Countries: Refers to the total number of countries in which your customers can from.
- Authors: Refers to the total number of product authors of which their product is purchased by a customer.
- Gross Earnings: Refers to the revenues for each product made during the selected time period.
- Discount Codes Used: Refers to the total number of discount codes used by the customer when purchasing your products.
- Total Discounts: Refers to the total amount of discounts used by the customers.
- Total Tax: Refers to the total amount of tax accumulated and paid by customers.
- Net Earnings: Refers to the net earnings, less discounts, tax and commissions, for each product made during the selected time period.
- Total Commission: Refers to the total amount of vendor/author commissions accumulated during a customer purchase.
- Total Profit: Refers to the total amount of profits from a customer purchase.
- AOV: Refers to the average dollar amount spent each time a customer places an order on a website or mobile app.
- New Customers #: Refers to the total number of new customers registered during the given time period.
- Paid: Refers to the percentage of customer orders that has been successfully paid by customers during checkout.
We also have comprehensive filter section which allow you to filter the reports by:
- Range of Date
- By Product
- By Country
- Earnings
- By Author
- Order Value
- Taxes – with our without
- Sales Type – Free, Paid or Free and Paid
- Type of Payment Gateway
- Subscriptions
- Customers
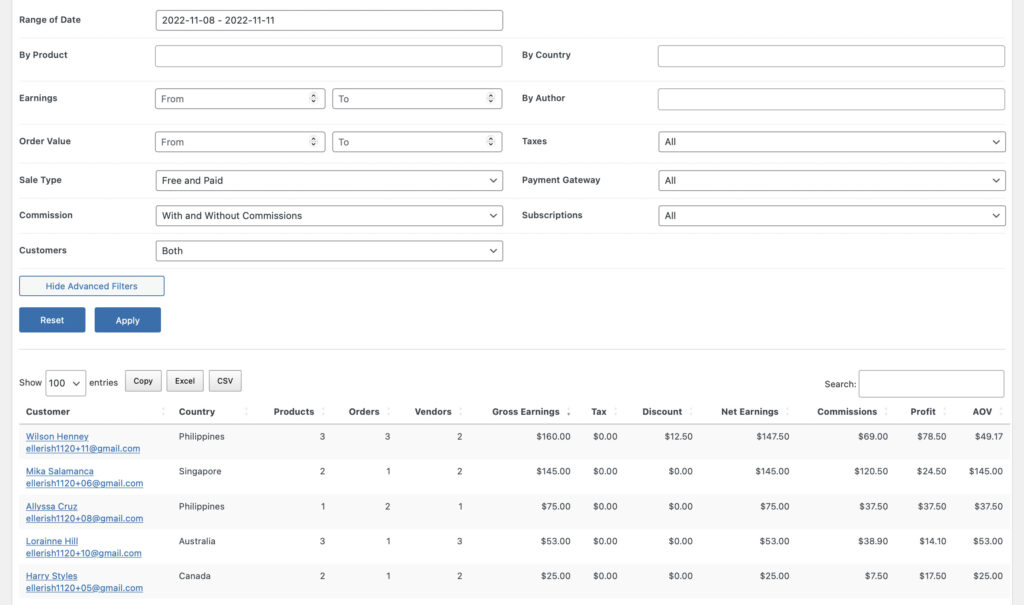
Then lastly, down below the page you will see a list of all customers, including some information related to their orders.
Report By Vendors
The seventh report is the report by vendor. Here, it summarizes the sales and profits made to the vendor’s products during for the selected time period and search filters.
Here we have a Gross Earnings Chart which shows you the trend of sales revenues from the given time period.
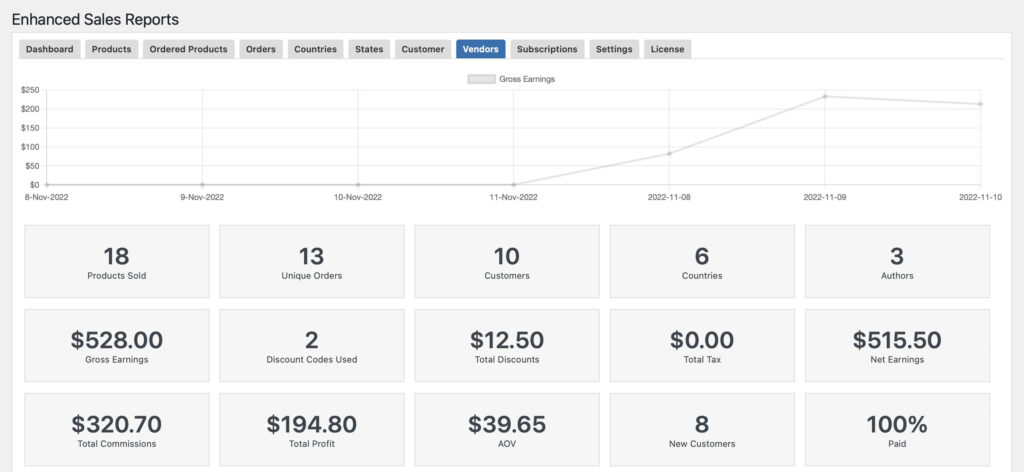
Also included in the dashboard are the important KPIs such as:
- Products Sold: Refers to the total number of products sold within the given time period.
- Unique Orders: Refers to the total number of unique orders made within the given time frame.
- Customers: Refers to the total number of customers transacted within your webstore.
- Countries: Refers to the total number of countries in which your customers can from.
- Authors: Refers to the total number of product authors of which their product is purchased by a customer.
- Gross Earnings: Refers to the revenues for each product made during the selected time period.
- Discount Codes Used: Refers to the total number of discount codes used by the customer when purchasing your products.
- Total Discounts: Refers to the total amount of discounts used by the customers.
- Total Tax: Refers to the total amount of tax accumulated and paid by customers.
- Net Earnings: Refers to the net earnings, less discounts, tax and commissions, for each product made during the selected time period.
- Total Commission: Refers to the total amount of vendor/author commissions accumulated during a customer purchase.
- Total Profit: Refers to the total amount of profits from a customer purchase.
- AOV: Refers to the average dollar amount spent each time a customer places an order on a website or mobile app.
- New Customers #: Refers to the total number of new customers registered during the given time period.
- Paid: Refers to the percentage of customer orders that has been successfully paid by customers during checkout.
We also have comprehensive filter section which allow you to filter the reports by:
- Range of Date
- By Product
- By Country
- Earnings
- By Author
- Order Value
- Taxes – with our without
- Sales Type – Free, Paid or Free and Paid
- Type of Payment Gateway
- Subscriptions
- Customers
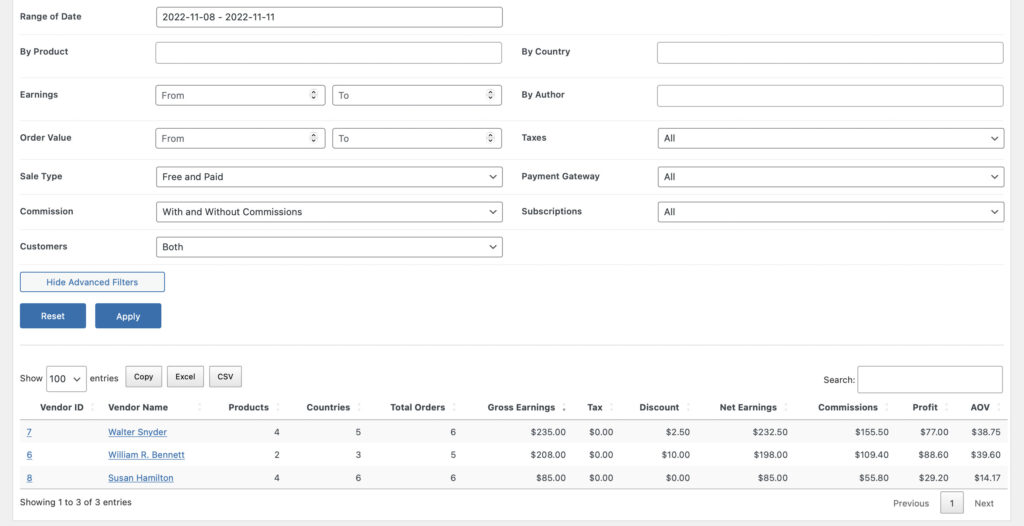
Then lastly, down below the page you will see a list of all vendors, including some information related to the purchases made on their products.
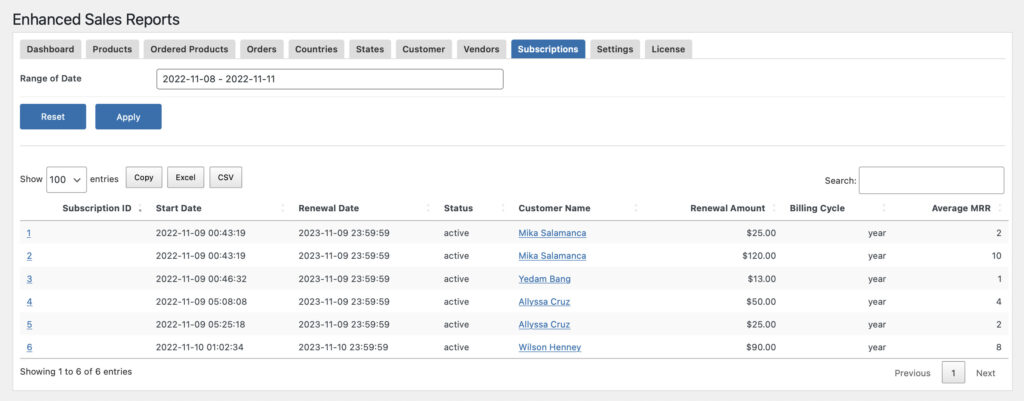
Report By Subscriptions
The last report is the report by subscriptions. This is most important for digital webstore owners selling subscriptions as monitoring this is vital for the overall webstore. Here, it summarizes the sales and profits per subscription purchase made on the webstore for the selected time period and search filters.
Here we have a Gross Earnings Chart which shows you the trend of sales revenues from the given time period.
Also included in the dashboard are the important KPIs such as:
- Products Sold: Refers to the total number of products sold within the given time period.
- Unique Orders: Refers to the total number of unique orders made within the given time frame.
- Customers: Refers to the total number of customers transacted within your webstore.
- Countries: Refers to the total number of countries in which your customers can from.
- Authors: Refers to the total number of product authors of which their product is purchased by a customer.
- Gross Earnings: Refers to the revenues for each product made during the selected time period.
- Discount Codes Used: Refers to the total number of discount codes used by the customer when purchasing your products.
- Total Discounts: Refers to the total amount of discounts used by the customers.
- Total Tax: Refers to the total amount of tax accumulated and paid by customers.
- Net Earnings: Refers to the net earnings, less discounts, tax and commissions, for each product made during the selected time period.
- Total Commission: Refers to the total amount of vendor/author commissions accumulated during a customer purchase.
- Total Profit: Refers to the total amount of profits from a customer purchase.
- AOV: Refers to the average dollar amount spent each time a customer places an order on a website or mobile app.
- New Customers #: Refers to the total number of new customers registered during the given time period.
- Paid: Refers to the percentage of customer orders that has been successfully paid by customers during checkout.
We also have comprehensive filter section which allow you to filter the reports by:
- Range of Date
- By Product
- By Country
- Earnings
- By Author
- Order Value
- Taxes – with our without
- Sales Type – Free, Paid or Free and Paid
- Type of Payment Gateway
- Subscriptions
- Customers
Then lastly, down below the page you will see a list of all customer subscriptions, including some information related to that order.
Download your Data via Excel, CSV, Copy/Paste
For downloading the report data, we have included options that will allow you to download the reports as Excel, CSV files, or have them copied directly in your memory/clipboard. This is especially useful if you wish to process your data further in a spreadsheet program. If you refer to the screenshot above, you can see the Download buttons right next to the Column Visibility button.
Settings
Here some few general settings for the plugin:
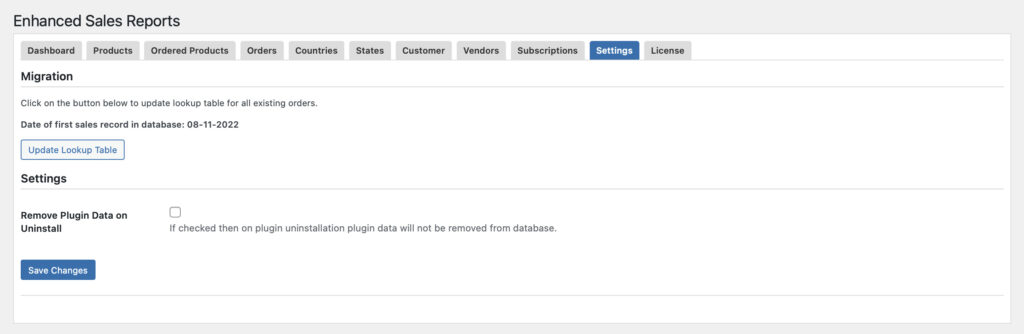
Migration – You can click the “Update Lookup Table” to update lookup table for all existing orders.
Remove Plugin Data on Uninstall – Enable/Disable
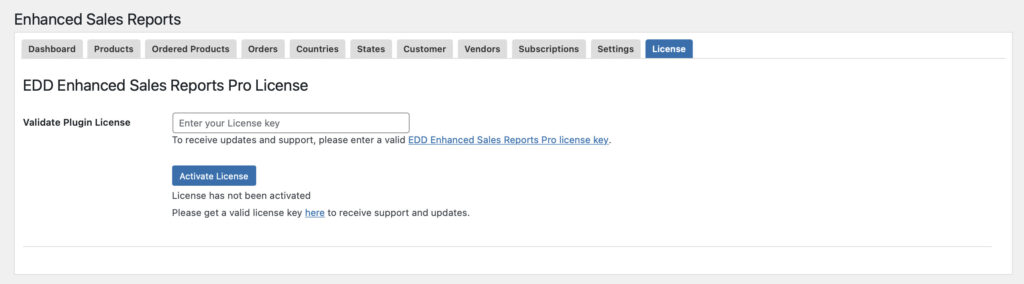
License
In order to receive support and updates, you need to enter here your valid license for our EDD Enhanced Sales Reports Pro Plugin.
In conclusion, we hope that this documentation was useful to you. If you have any questions regarding this plugin or other plugins you have in mind, kindly drop us a comment below or simply contact us.