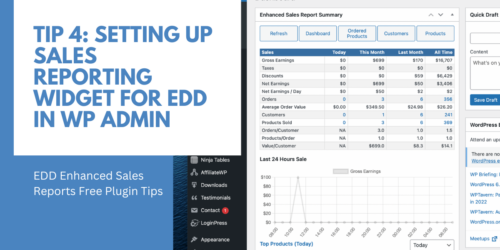
Do you want to quickly see a sales report summary right after logging in on your WP-Admin Dashboard? Now, you can do so using our EDD Enhanced Sales Reports Plugin!
Upon installation and activation of the plugin on your webstore, the widget will automatically appear on the backend Dashboard, right on your /wp-admin/ website address.
To solve this, all you have to do is to move it up among all other widgets so you can easily take a look at your Sales Report Summary in one glance. Below is how the widget looks like.
Please note, if you have many widgets installed already it might be easy to overlook it. Upon installing EDD Enhanced Sales Report Plugin, we recommend to look for the widget and in case it is at the bottom of the /wp-admin/ page in WordPress, move it up so that you can see the sales figures on first glance whenever you visit your dashboard in WordPress.
Now, you can easily check how your sales performance is currently doing, along other important metrics you want to monitor on a daily basis such as Gross/Net Earnings, Average Order Value, Products Sold, Top Products, Top Customers, and many more. We hope this helps you more in measuring the revenue generating performance of your webstore.
KPIs, or Key Performance Indicators, can be used to measure and track the sales performance of your EDD webstore. These are the metrics to understand sales and to extract factors which drive sales. So how do we find this out? Here’s the magic formula we can use:
Net Earnings = Number of Paid Orders x Average Order value
Or extended: Net Earnings = Number Total Orders x Paid Conversion % x Average Order value
Now, how can we understand and get the variables for this formula?
On the EDD Enhanced Sales Report Plugin’s dashboard interface, you can see a lot of general KPIs needed to measure and track the performance of your webstore. Below are some top KPIs we suggest you to keep an eye out more, you can see them by accessing any of the sales report on the plugin.
(1) Net Earnings – provide an accurate measure of a webstore’s financial performance. By tracking net earnings, webstore owners can identify areas where they can reduce expenses and increase profits. Knowing the amount of money, they have available after all expenses are paid, webstore owners can make informed decisions.
EDD generally use Gross Earnings which includes taxes, but for reporting purposes, we need to better understand earnings less any eventual taxes. Investors want to see a healthy net income as a sign that the business is financially stable and has potential for growth.
We basically want to use both, a) Gross earnings which can help us understand how much revenue we’re generating in general, while net earnings can help us understand how much profit we’re making after all expenses and taxes have been accounted for.
(2) Products Sold – this pertains to the number of products sold on your webstore from the selected time period. This helps us measure sale performance and determine if we are meeting our sales goals, as well as to evaluate our sales strategies and identify areas for improvement.
(3) Free to Paid Percentage – as already discussed, tracking conversion from free to paid products on your EDD webstore is an essential aspect especially if you’re both offering free and paid products. You should aim for a high paid percentage which basically means your customers loved your Free Products, that they felt the need to obtain more features which allows them to upgrade and purchase the Paid Product.
(4)Number of Paid Orders – knowing how much of the orders received are paid is an accurate measure of real webstore’s sales performance. This is also used to compare and check the conversion from free to paid orders, which is essential to know your webstore’s revenue generating capacity.
(5)Average Order Value (AOV) – generally, this metric only includes paid orders making it an accurate measure of actual order value. If the AOV is low, webstore owners can develop strategies to upsell customers or offer promotions to increase the value of each order. This can also provide insights into customer behavior and preferences. If the AOV is high, webstore owners can analyze the data to understand what is driving those higher sales and adjust their strategies accordingly. Tracking this helps webstore owners identify opportunities to increase revenue.
Overall, KPIs are an important tool for businesses to measure, track, and optimize their performance, helping them to achieve their goals and objectives in an efficient and effective way.
Using the EDD Enhanced Sales Reports Plugin, you can know how many paid and free products getting purchased, as well as a Paid Products sales percentage. You can find these KPIs when checking any of the reports tab, such Products tab.
When a customer starts using your free product, they are essentially trying it out and deciding whether or not it meets their needs. By tracking conversion rates, you can gain insights into what motivates customers to upgrade to a paid version of your product.
Tracking sales conversion from free to paid products on your EDD webstore is an essential aspect especially if you’re both offering free and paid products. This allows you to monitor the effectiveness of your marketing campaigns, improve your product offerings, and ultimately increase your revenue.
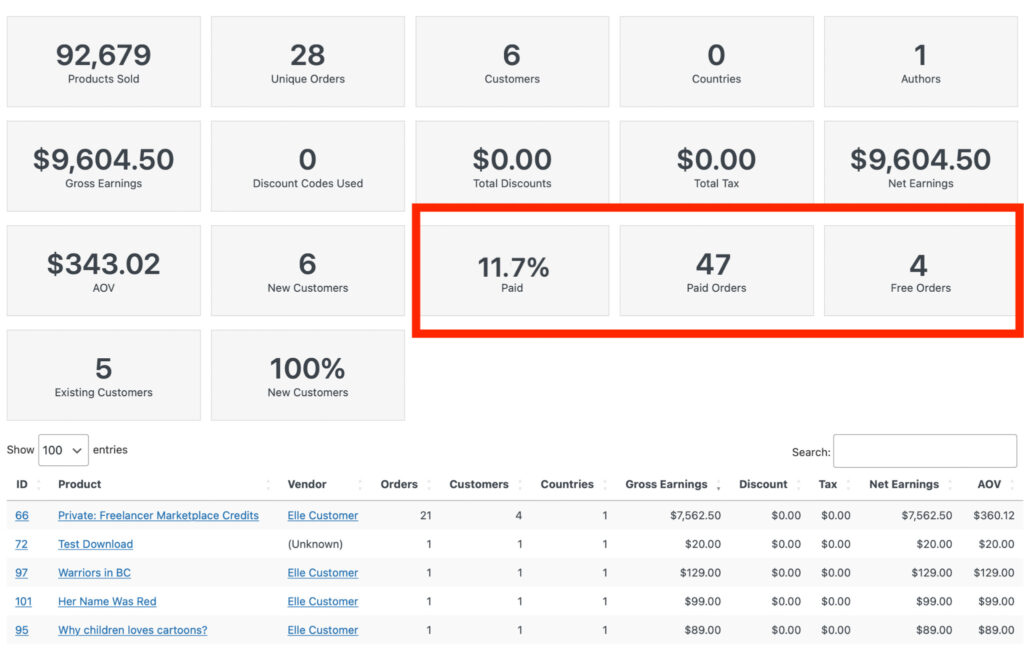
Here are the KPIs you can see on our By Product Sales Report. We should focus on the # of Paid Orders, # of Free Orders, and the Paid Orders Percentage.
What does a high paid orders percentage mean?
This means your customers loved your Free Products, that they felt the need to obtain more features which allows them to upgrade and purchase the Paid Product. We should study how your Free Product Versions should look like, not giving away too much features for the free users, then making them realize that they needed more.
Then, we market the Paid Product Version, having all the major and necessary features they actually need, which when properly documented and explained, will likely turn into sales.
What does a low paid orders percentage mean?
However, a low percentage means your customers didn’t want to purchase the paid version because:
a) Offers little value compared to Free Version,
b) Paid Version features not attractive enough,
c) Free Version already gave too much features that customers settled for it,
d) Paid Version is too pricey, and many others.
Overall, tracking conversion from free to paid products is crucial for your EDD webstore selling free and paid products. By monitoring and analyzing conversion rates, you can make data-driven decisions that will help you improve your marketing, and product offerings, and ultimately increase your webstore’s revenue.
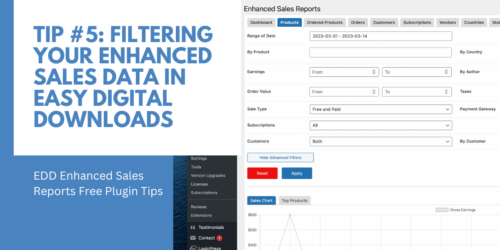
Our EDD Enhanced Sales Report plugin comes with a number of filters on every sales report. You can see these filters for example on your Products Report tab, click on “Show Advanced Filters” button.
These filters below can be used to better analyze your sales data in Easy Digital Downloads webstore. This is helpful if you want to only view a specific subset of sales data, for example, orders only for a specific product. Below is an example from our By Products Sales Report.
The filters you can apply on this sales report are the following:
Range of Date – Show data within a certain time frame, such as a particular day, week, month, quarter, or year. This can help users to identify trends and changes in sales performance over time.
By Product – Use to focus on specific products or services within the sales data, allowing users to analyze performance metrics for individual items.
Earnings – This filter can be useful when you are looking to analyze certain price segments of the products of your store.
Order Value – This filter can be used when you like to zoom in on certain ranges in terms of average product values.
Sale Type – This can either be Free and Paid, Free Only, or Paid Only. Basically, if you want to see the total of only all paid sales, you can do so, and vice versa.
Customers – Sales data for specific customer segments, specifically, new or existing customers.
By Country – Use to analyze sales performance in specific geographic regions, specifically, by country.
By Author – Allows users to analyze sales data for specific authors or creators, in order to track performance metrics for each individual author.
Taxes – Allow users to filter sales data whether its inclusive or exclusive of tax.
Payment Gateway – Allow users to filter sales data which payment gateway has been used to complete the purchase.
By Customer – Allow users to filter sales data per specific customer, gaining more insights on your top customers.
By applying these filters to their sales reports, users can gain a deeper understanding of their sales performance and make data-driven decisions to improve their results.
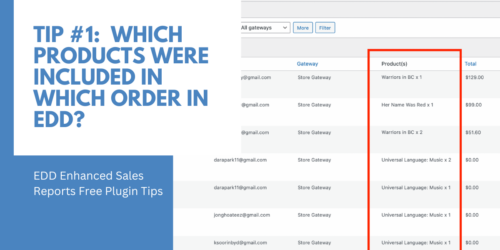
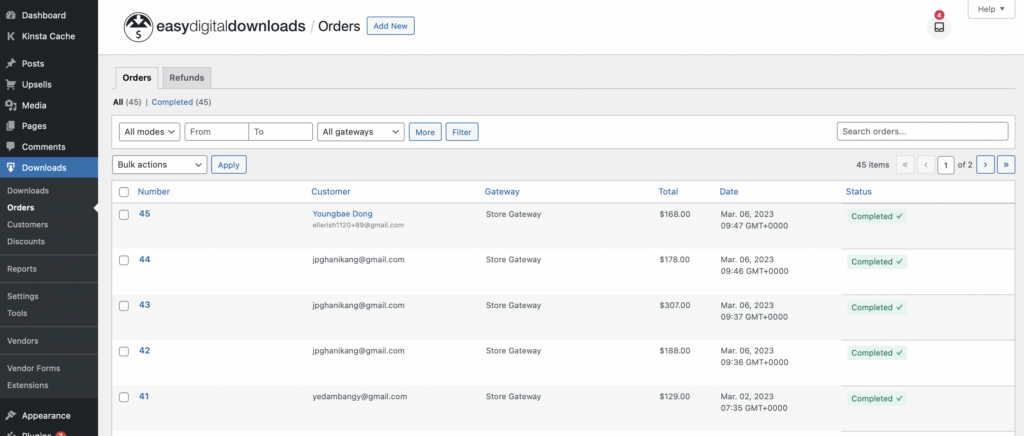
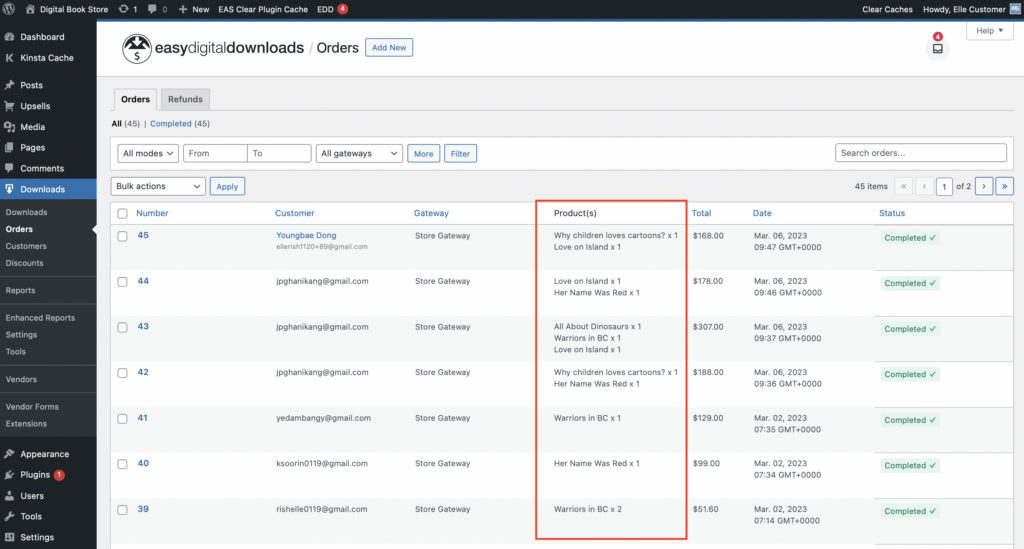
When operating an Easy Digital Downloads WordPress webstore, one problem with the standard Order Report in Easy Digital Downloads is that you can’t see in one glance, all products that have been purchased, on a single order.
Below is how the standard Orders page in EDD can be found in WP Admin, Menu Downloads, and submenu Orders. Basically, the list doesn’t show what products have been purchased on that order, making it difficult for users to check, without opening each order’s page.
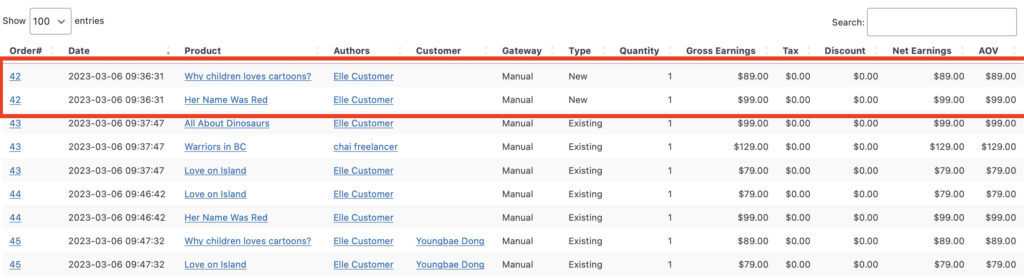
But now, with our EDD Enhanced Sales Reports Plugin, we offer an interesting feature that actually improves your Order Report dramatically – it adds a column on the order page where you can see which products were included in which order.
How to enable it? Visit our plugin’s settings page, and enable “Show Ordered Products in Purchase History Table”.
After enabling, check the Orders Report on your EDD website, and see the new Products column containing the products purchased on that specific order.
With this feature enabled, your order report now suddenly becomes much more useful. Now you know exactly which products sold were included in which order. Understanding your orders and the products included becomes easy to check recent products sold in one glance.
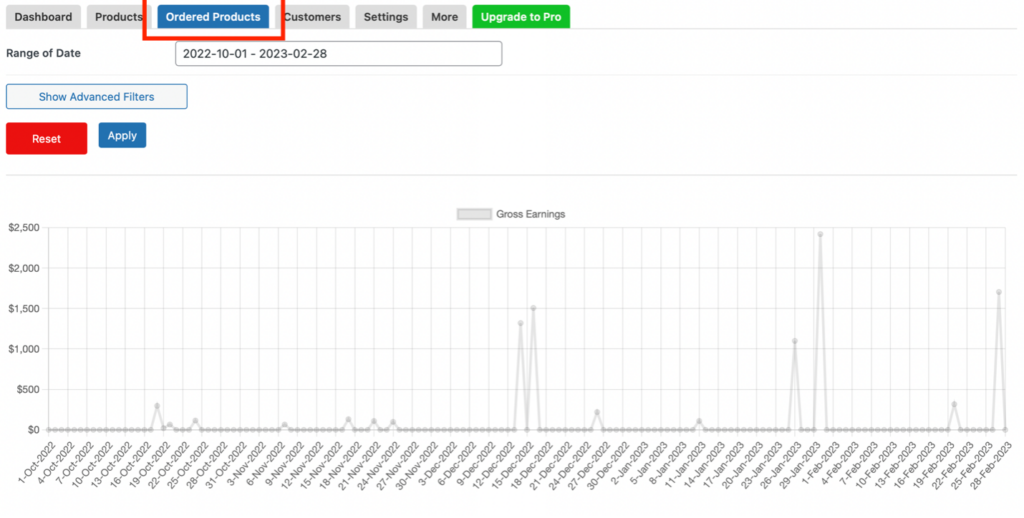
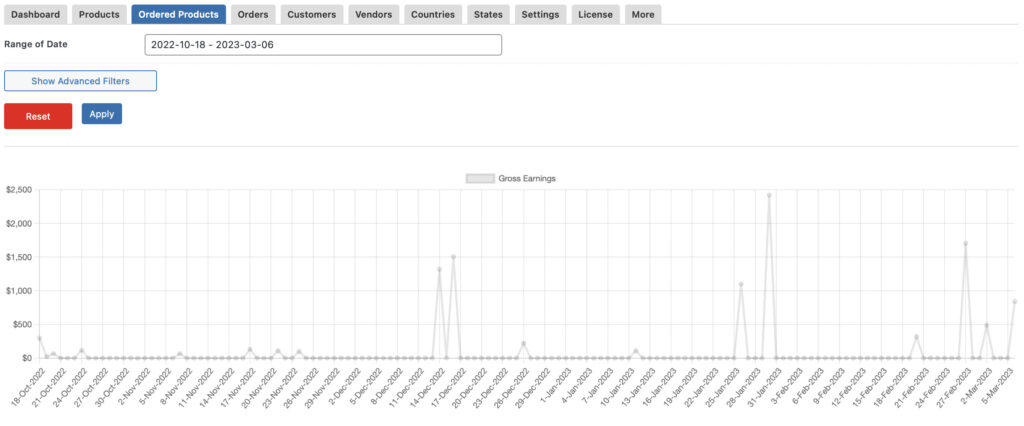
The Ordered Products Report
The sales data actually is derived from the tab Ordered Products in EDD Enhanced Sales Report plugin. You can find this report in the tab highlighted below in the Menu Downloads, Enhanced Sales Report [] when the EDD Enhanced Sales Report plugin is active.
What this report does is track not the orders but actually, lists each product sold included in the orders. As with all reports in the EDD Enhanced Sales Report plugin, the report comes with a sales chart, filters, and a detailed data table supporting the calculation of the reported sales values.
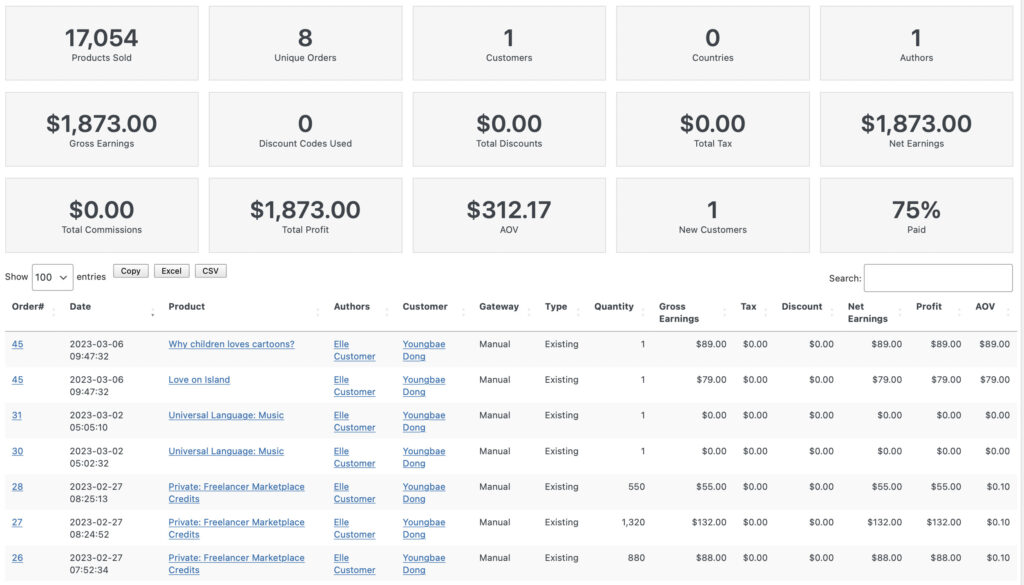
This report shows the products being bought per order basis. This makes users to easily track the products per order, as well as important order information such as Quantity Sold, Gross Earnings, Tax, and Discount included in the order, Net Earnings after deducting such expenses, and Average Order Value per order.
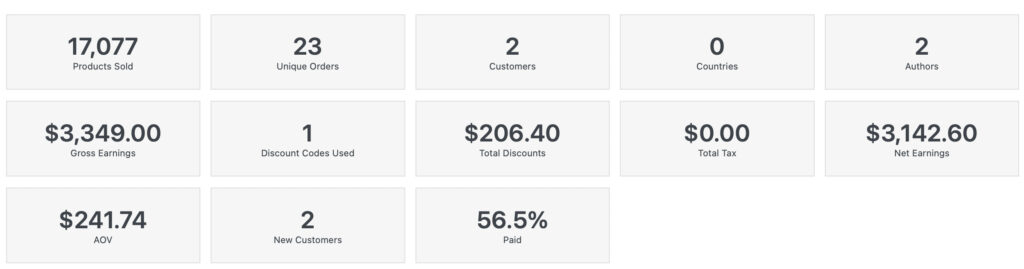
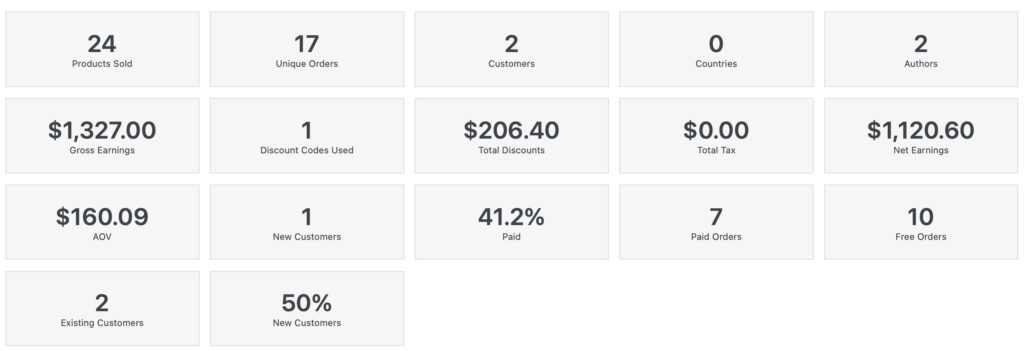
In this report, users can also see some important Key Performance Indicators (KPIs) to measure and track products sold using the following parameters:
Products Sold – no. of products sold within the selected time period
Unique Orders – no. of orders per unique customer
Customers – no. of customers who placed their order within the selected time period
Countries – no. of countries where customers who placed their orders are located
Authors – no. of product authors whose products are purchased
Gross Earnings – value of earnings before deducting discounts and taxes
Discount Codes Used – no. of discount code used in the customer’s orders
Total Discounts – total value of discounts used from orders within the selected time period
Total Tax – total value of tax included from orders within the selected time period
Net Earnings – value of earnings after deducting discounts and taxes
AOV – Average order value per product
New Customers – no. of new customers who placed an order
Paid Orders – no. of paid orders made
As you can see, the Ordered Products report offers you a comprehensive understanding of which products were sold when and to whom in which order. It is a great report to use when you have to investigate certain sales events or need to find out which products have been sold when to whom.
Products ordered by Customer
In Easy Digital Downloads you can obtain a detailed profile of each customer when you use the menu Downloads, Submenu Customers. You can click on any customer profile link and get to the screen below in the profile tab.
The Enhanced Sales Report plugin now places a special button right on the customer backend profile in the Recent Order section where users can pull up a link of the ordered products by customer.
This button will take you to the Ordered Products Report, filtering products only for that specific customer, giving you access for more details regarding the customer’s purchasing behaviour.
Operating an Easy Digital Downloads webstore requires a couple of things to consider, especially if you want to enhance the sales performance of your store. Implementing a good marketing strategy is a must, but are you monitoring and tracking your sales results on a timely basis? How have you implemented a good solution to report and analyze sales data?
After some time, you might be getting a decent number of sales, but do you have any idea which products are being sold the most? Do you know how much your sales revenue is per order? Do you know which are your best-selling products that can be further improved?
To better analyze sales performance by product, you can use the reports tab in the EDD Enhanced Sales Report Plugin. You can find this report in the tab highlighted below in the Menu Downloads, Enhanced Sales Report [] when the EDD Enhanced Sales Report plugin is active.
Using the Top Products List on the by Product Sales Reports Tab, you can have a chart and list showing the sales performance of your Top Products in your selected time period along with important sales metrics to measure and track.
What you can see in the chart above, is a sales report of the top 10 best-selling product and their earnings as per a selected time period and showing the earnings by product. Please note, there is also a filter menu included below the range of data selectors which allows using more advanced filters and filtering the earnings figures by author, customer, range of average order values, and many more criteria.
A next important item is to obtain a quick view on your store performance overall. For this please refer to the listed key performance indicators on top of each report page. In the
Also, Key Performance Indicators (KPIs) to measure the sales performance of your webstore, such as:
Products Sold – no. of products sold within the selected time period
Unique Orders – no. of orders per unique customer
Customers – no. of customers who placed their order within the selected time period
Countries – no. of countries where customers who placed their orders are located
Authors – no. of product authors whose products are purchased
Gross Earnings – value of earnings before deducting discounts and taxes
Discount Codes Used – no. of discount code used in the customer’s orders
Total Discounts – total value of discounts used from orders within the selected time period
Total Tax – total value of tax included from orders within the selected time period
Net Earnings – value of earnings after deducting discounts and taxes
Average Order Value (AOV) – average order value spent on average for each product sold. Please note that this figure only includes paid products.
New Customers – no. of new customers who placed an order
Paid Order Percentage – the percentage of orders which is paid
Paid Orders – no. of paid orders made
Free Orders – no. of free orders made
Existing Customers – no. of customers that placed another order, or basically repurchases
New Customers Order Percentage – the percentage of orders coming from new customers
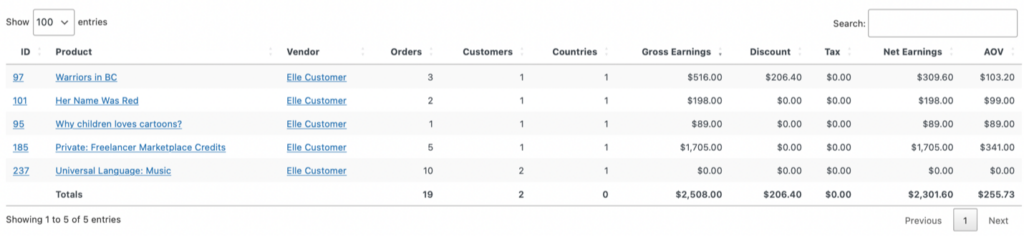
Down below the page, we have a table, listing all products that have been purchased in the selected time period, along with other important order details we must know, such as:
Product Author – indicates the name of the product author which has been purchased
Orders – no. of orders placed by a customer
Customers – no. of customers who placed an order for that product
Countries – no. of countries in which the customer has purchased the product
Gross Earnings – the value of earning without deducting discounts and taxes incurred
Tax – the value of tax incurred on the order purchased
DiscountValue – the value of discount used on the order purchased
NetEarnings – the value of earnings after deducting discounts and taxes incurred
AOV(Average Order Value) – the average order value per product obtained. Please note, this is especially of relevance if your products include the sale of different versions and you want to figure out what is the average order value for each product. Please also note that the AOV only includes paid orders (excludes the counting of free products downloaded).
Overall, knowing your best-selling products and comparing their sales metrics can lead to important insights into the sales performance of your Easy Digital Downloads Webstore and allows for better reporting. Using the product’s sales report to compare poor performance vs. the benchmark revenue figures of your best-selling products allows you to better identify unused potentials to improve some of your products in order to increase their average order values. Using sales data effectively allows for identifying the reasons why some products are selling better than others and can lead to new ideas on how to create better-selling products. This is especially relevant in the case of selling digital downloadable products which can easier be produced and changed than manufactured products such as those sold in WooCommerce.
If you have a moment, please take a minute and tell us how well did you like EDD Enhanced Sales Reports Plugin by leaving a quick rating on WordPress Plugin Directory.
As a digital web store owner using Easy Digital Downloads, you can generate different types of sales data such as order data, vendor data, customer data, product data, revenue data, profit data, vendor data, geographic data, and any other important data you can get and make use of for your Easy Digital Downloads WordPress web stores.
Now, you may have several eCommerce data in you, taken and generated from your EDD stores, but what significance can it bring to you? What can you get out of it? How those numbers can actually help your business grow? Do you know how to efficiently use those data for effective decision making?
Importance of Sales Data Analysis
Sales Data Analysis in eCommerce provides businesses with a deeper understanding of customer habits and preferences. If you analyze sales data, it can give you a conclusion as to how are your products are doing? Why is your sales trend going up or down for a specific time period? What does your customer in a specific location want? Why some of your vendors are not doing well? And many other questions that can give light to your business decision-making.
eCommerce Sales Analytics will allow digital web stores to boost sales and conversions by running targeted campaigns to promote products among the different audience or customer segments that in turn, will eventually maximize their profits. Also, we can discover additional untapped sales potential that they can also work on and try. But most importantly, these sales analytics will help them to do better in everything – products, vendors, marketing campaigns and many other sales and business aspects.
Analyze Sales Data using EDD Enhanced Sales Reports Plugin
Tracking sales and understanding where the sales come from is essential when you look to optimize your Easy Digital Downloads store. The EDD Enhanced Sales Reports Plugin offers additional analytics and reporting features to better understand where sales and profit data come from.
The goal of this plugin is to help EDD webstore owners extract all critical sales data from their website, and guide on how to use the best out of those metrics on optimizing the sales performance of the webstore.
Tips on utilizing the EDD Enhanced Sales Reports Plugin
In order for users to get the most of out those sales data, we have prepared several tips and guides how to use best the EDD Enhanced Sales Reports Plugin for data analysis.
Being able to correctly and effectively analyze sales data on your EDD stores can have a major impact on your sales performance in the long run. Make sure you checked everything on the list above in order to properly improve your web store’s performance.
But, if you want to get an even extensive sales reporting with a lot more reporting features and customization, do not hesitate to try our EDD Enhanced Sales Report Pro Plugin. Kindly check the product page for the full plugin details.
This documentation covers all information required with respect to the EDD Enhanced Sales Report Plugin such as how to install, how it works, and features included.
The EDD Enhanced Sales Report Plugin is a WordPress plugin extension for Easy Digital Downloads eCommerce stores that provide detailed sales and profits reports in order to obtain a better understanding from where sales and profits come from.
Enjoy a lot of features to help filter your store’s sales and profit data according to certain specifications such as filter by product, by customer, by country, by vendor, and many more. This plugin offers you great insights into customer behaviors, market segments, and vendor management. Therefore, this plugin is a recommended add-on to your Easy Digital Downloads store.
How to Install the EDD Enhanced Sales Plugin
In any case that you still don’t have the plugin yet, feel free to purchase it now!
Once you acquire the plugin, you need to manually install it. Open the admin panel of your WordPress website, go to Plugins and choose “Add New”. After that, you will see the screen to the right.
Proceed as follows accordingly:
Add New Plugin: Firstly upload the plugin either via File Upload (Screenshot above) or via FTP in the plugins WordPress folder.
Plugins: Then, go to the Installed Plugins page, look for EDD Enhanced Sales Report Plugin and ensure the Plugin is activated.
Downloads / Reports: Lastly, go to the Downloads menu (which shows up once Easy Digital Downloads Plugin is installed), then click on the submenu Reports and now the “Enhanced Reports” tab will show up.
Finally, you are ready to go. Check through the Enhanced Sales Reports to enjoy the features provided.
How does the Plugin work?
The plugin has several elements which we will go over in detail for you here:
Tabs
These are several important reports available which allow you to efficiently search through the sales and profit data of your Easy Digital Downloads Store.
Dashboard
Report by Product
Report by Ordered Products
Report by Orders
Report by Countries
Report by States
Report by Customer
Report by Vendors
Report by Subscriptions
Settings
License
The reports aim to provide you with important insights from where the sales and profits come from. Generally, the important questions to be answered are the following: Which countries do you sell best to? What are the best products to sell to by each country? From which vendors can you make most profits? How do sales compare to the previous month or the previous year? Which products are sold to which states (e.g. relevant for the US)? Also, which customers show the highest ARPU? etc.
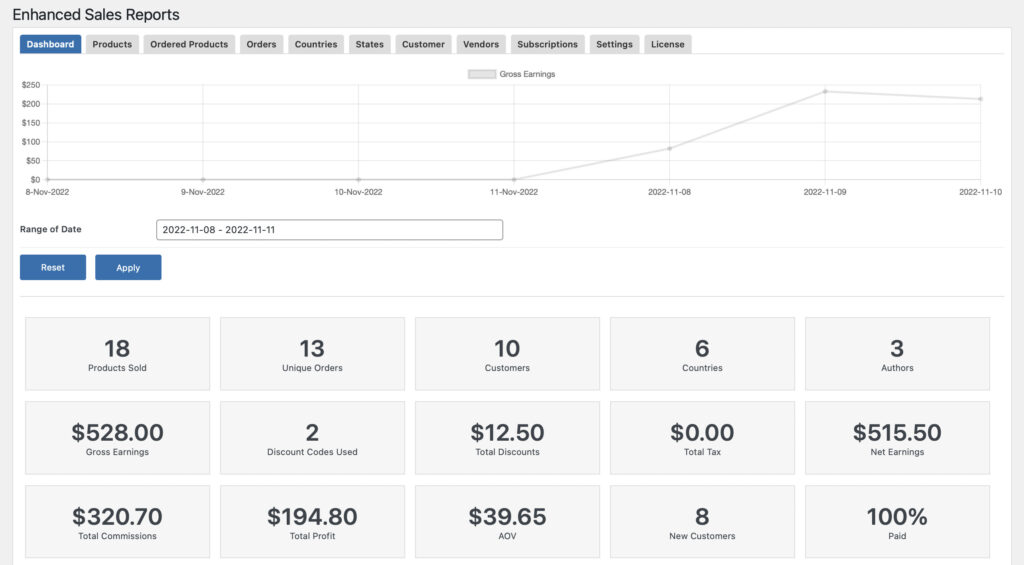
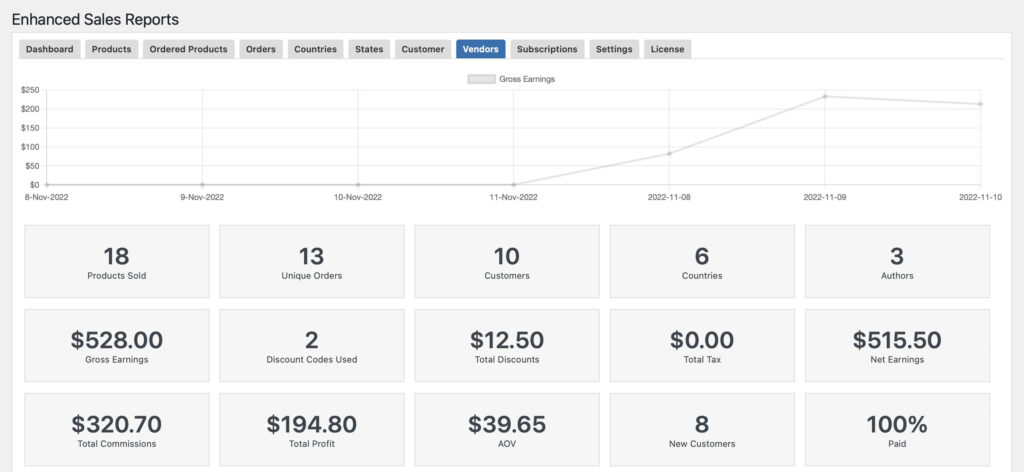
Dashboard
The Dashboard summarizes everything you need to quickly check and monitor related to your Sales Revenue Flow.
Here we have a Gross Earnings Chart whichshows you the trend of sales revenues from the given time period.
Also included in the dashboard are the important KPIs such as:
Products Sold: Refers to the total number of products sold within the given time period.
Unique Orders: Refers to the total number of unique orders made within the given time frame.
Customers: Refers to the total number of customers transacted within your webstore.
Countries: Refers to the total number of countries in which your customers can from.
Authors: Refers to the total number of product authors of which their product is purchased by a customer.
Gross Earnings: Refers to the revenues for each product made during the selected time period.
Discount Codes Used: Refers to the total number of discount codes used by the customer when purchasing your products.
Total Discounts: Refers to the total amount of discounts used by the customers.
Total Tax: Refers to the total amount of tax accumulated and paid by customers.
Net Earnings: Refers to the net earnings, less discounts, tax and commissions, for each product made during the selected time period.
Total Commission: Refers to the total amount of vendor/author commissions accumulated during a customer purchase.
Total Profit: Refers to the total amount of profits from a customer purchase.
AOV: Refers to the average dollar amount spent each time a customer places an order on a website or mobile app.
New Customers: Refers to the total number of new customers registered during the given time period.
Paid: Refers to the percentage of customer orders that has been successfully paid by customers during checkout.
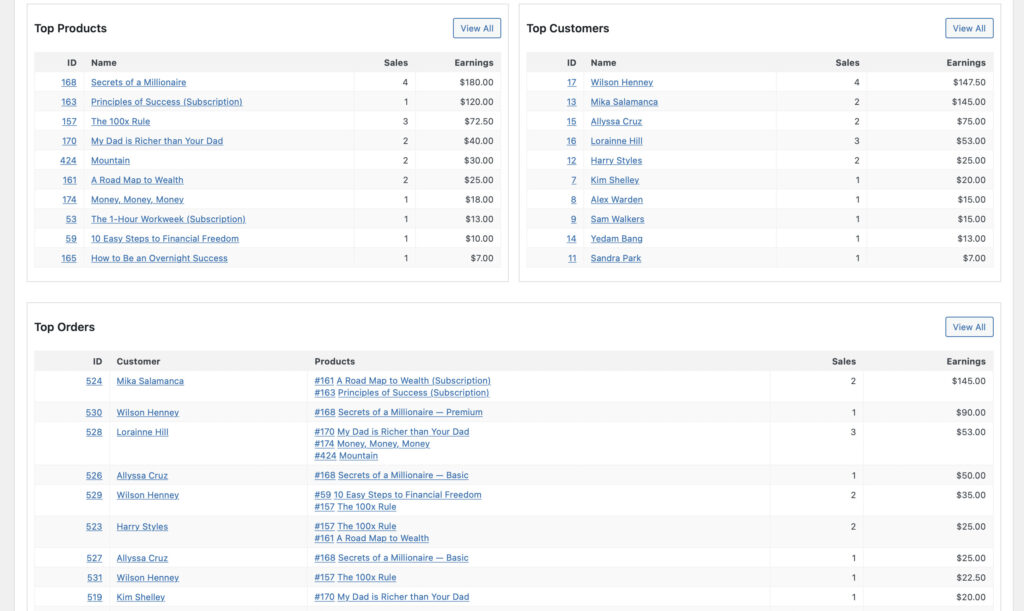
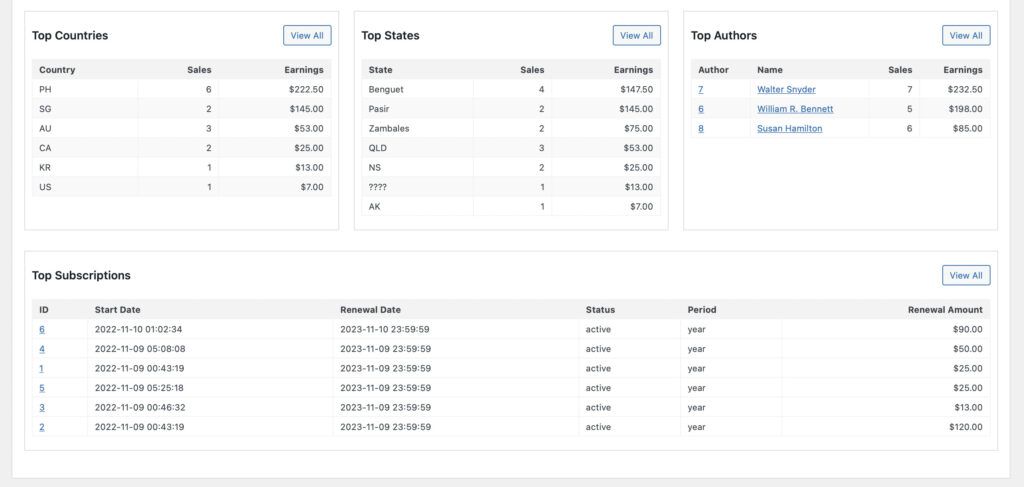
We also list down the following vital information that site admins will love to review and monitor, such as:
Top Products
Top Customers
Top Orders
Top Countries
Top States
Top Authors
Top Subscriptions
Report By Product
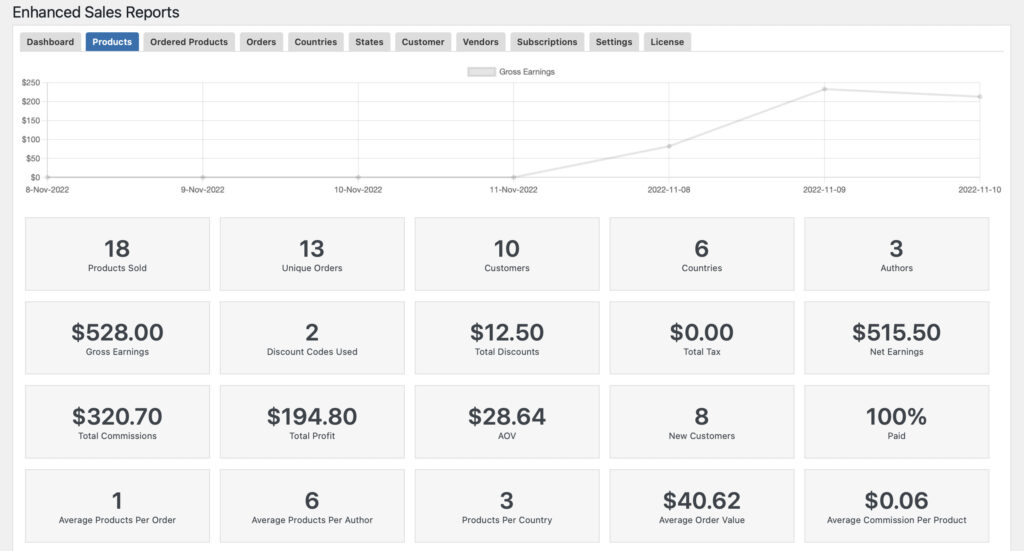
The first kind of report is the report by product. Here, it summarizes the sales and profits per product for the selected time period and search filters.
Here we have a Gross Earnings Chart whichshows you the trend of sales revenues from the given time period.
Also included in the dashboard are the important KPIs such as:
Products Sold: Refers to the total number of products sold within the given time period.
Unique Orders: Refers to the total number of unique orders made within the given time frame.
Customers: Refers to the total number of customers transacted within your webstore.
Countries: Refers to the total number of countries in which your customers can from.
Authors: Refers to the total number of product authors of which their product is purchased by a customer.
Gross Earnings: Refers to the revenues for each product made during the selected time period.
Discount Codes Used: Refers to the total number of discount codes used by the customer when purchasing your products.
Total Discounts: Refers to the total amount of discounts used by the customers.
Total Tax: Refers to the total amount of tax accumulated and paid by customers.
Net Earnings: Refers to the net earnings, less discounts, tax and commissions, for each product made during the selected time period.
Total Commission: Refers to the total amount of vendor/author commissions accumulated during a customer purchase.
Total Profit: Refers to the total amount of profits from a customer purchase.
AOV: Refers to the average dollar amount spent each time a customer places an order on a website or mobile app.
New Customers #: Refers to the total number of new customers registered during the given time period.
Paid: Refers to the percentage of customer orders that has been successfully paid by customers during checkout.
Average Products Per Order: Refers to the average number of products being purchased per customer order.
Average Products Per Author: Refers to the average number of products being purchased per author.
Products Per Country: Refers to the average number of products being purchased per customer country.
Average Order Value: Refers to the average dollar amount spent each time a customer places an order on a website or mobile app.
Average Commission Per Product: Refers to the average amount of vendor/author commissions accumulated per product order.
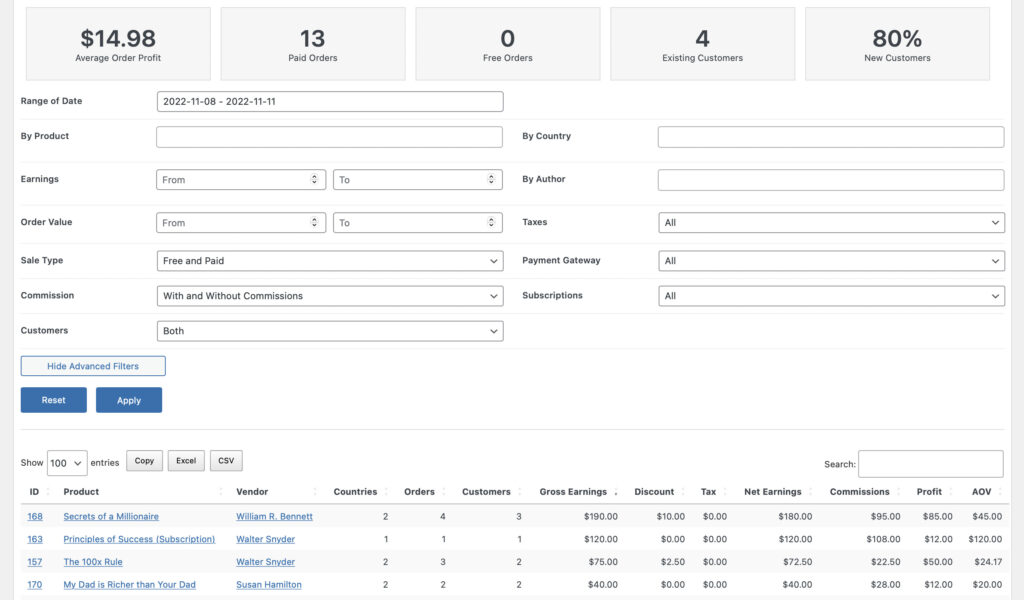
Average Order Profit: Refers to the average number of profit accumulated per customer order.
Paid Orders: Refers to the total number of paid orders during the given time period.
Free Orders: Refers to the total number of free orders during the given time period.
Existing Customers: Refers to the total number of existing customers during the given time period.
New Customers %: Refers to the total percentage of new customers who registered during the given time period.
We also have comprehensive filter section which allow you to filter the reports by:
Range of Date
By Product
By Country
Earnings
By Author
Order Value
Taxes – with our without
Sales Type – Free, Paid or Free and Paid
Type of Payment Gateway
Subscriptions
Customers
Then lastly, down below the page you will see a list of all orders per product, including some information related to that specific order.
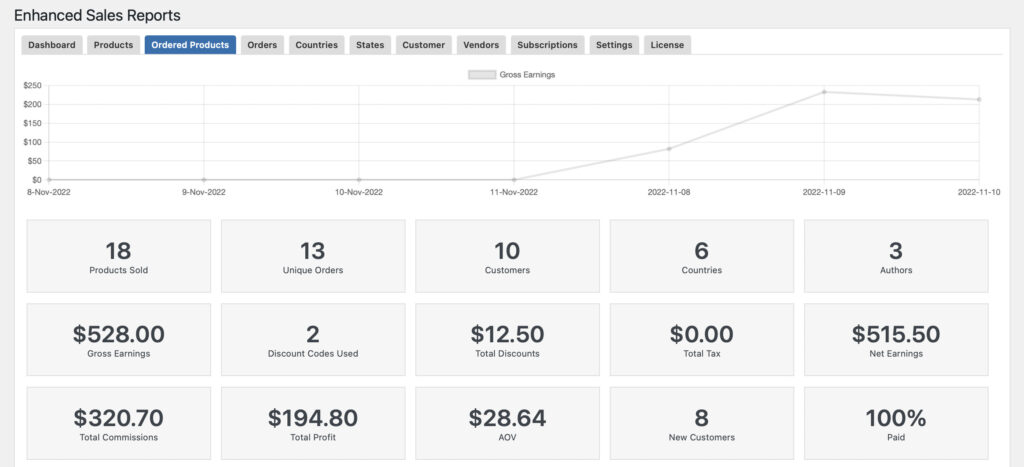
Report By Ordered Products
The second report is the report by ordered products. Here, it summarizes the sales and profits per ordered products for the selected time period and search filters.
Here we have a Gross Earnings Chart whichshows you the trend of sales revenues from the given time period.
Also included in the dashboard are the important KPIs such as:
Products Sold: Refers to the total number of products sold within the given time period.
Unique Orders: Refers to the total number of unique orders made within the given time frame.
Customers: Refers to the total number of customers transacted within your webstore.
Countries: Refers to the total number of countries in which your customers can from.
Authors: Refers to the total number of product authors of which their product is purchased by a customer.
Gross Earnings: Refers to the revenues for each product made during the selected time period.
Discount Codes Used: Refers to the total number of discount codes used by the customer when purchasing your products.
Total Discounts: Refers to the total amount of discounts used by the customers.
Total Tax: Refers to the total amount of tax accumulated and paid by customers.
Net Earnings: Refers to the net earnings, less discounts, tax and commissions, for each product made during the selected time period.
Total Commission: Refers to the total amount of vendor/author commissions accumulated during a customer purchase.
Total Profit: Refers to the total amount of profits from a customer purchase.
AOV: Refers to the average dollar amount spent each time a customer places an order on a website or mobile app.
New Customers #: Refers to the total number of new customers registered during the given time period.
Paid: Refers to the percentage of customer orders that has been successfully paid by customers during checkout.
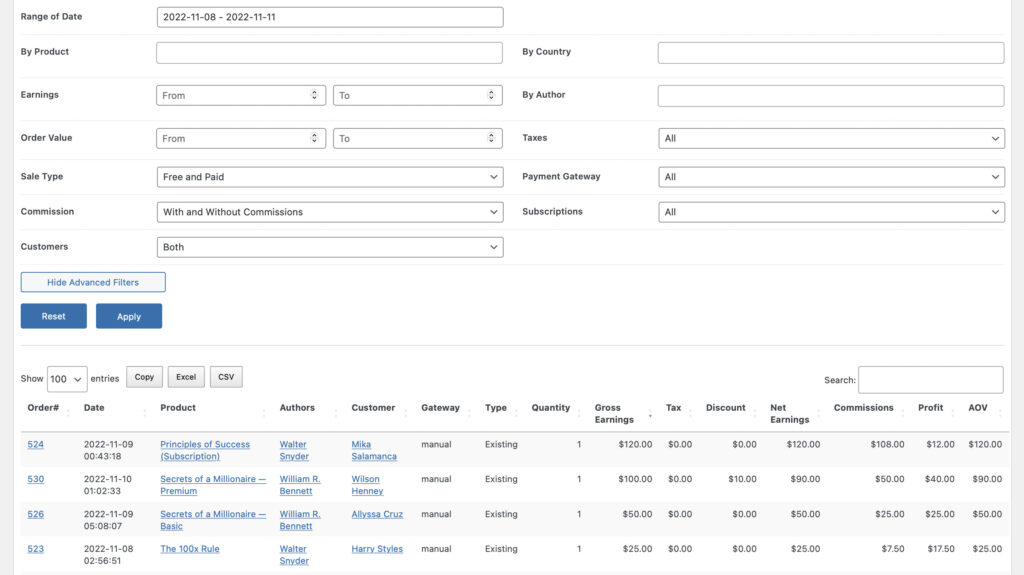
We also have comprehensive filter section which allow you to filter the reports by:
Range of Date
By Product
By Country
Earnings
By Author
Order Value
Taxes – with our without
Sales Type – Free, Paid or Free and Paid
Type of Payment Gateway
Subscriptions
Customers
Then lastly, down below the page you will see a list of all orders per product, including some information related to that specific order.
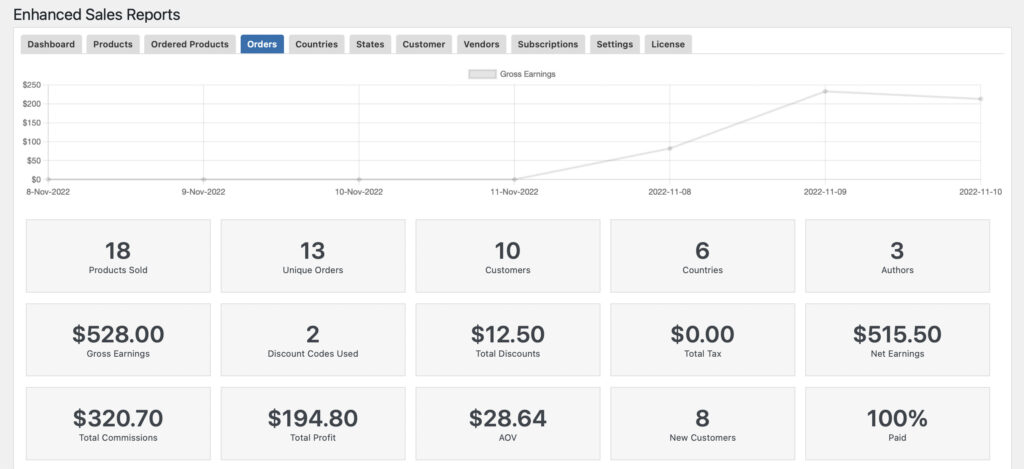
Report By Orders
The third report is the report by orders. Here, it summarizes the sales and profits per order for the selected time period and search filters.
Here we have a Gross Earnings Chart whichshows you the trend of sales revenues from the given time period.
Also included in the dashboard are the important KPIs such as:
Products Sold: Refers to the total number of products sold within the given time period.
Unique Orders: Refers to the total number of unique orders made within the given time frame.
Customers: Refers to the total number of customers transacted within your webstore.
Countries: Refers to the total number of countries in which your customers can from.
Authors: Refers to the total number of product authors of which their product is purchased by a customer.
Gross Earnings: Refers to the revenues for each product made during the selected time period.
Discount Codes Used: Refers to the total number of discount codes used by the customer when purchasing your products.
Total Discounts: Refers to the total amount of discounts used by the customers.
Total Tax: Refers to the total amount of tax accumulated and paid by customers.
Net Earnings: Refers to the net earnings, less discounts, tax and commissions, for each product made during the selected time period.
Total Commission: Refers to the total amount of vendor/author commissions accumulated during a customer purchase.
Total Profit: Refers to the total amount of profits from a customer purchase.
AOV: Refers to the average dollar amount spent each time a customer places an order on a website or mobile app.
New Customers #: Refers to the total number of new customers registered during the given time period.
Paid: Refers to the percentage of customer orders that has been successfully paid by customers during checkout.
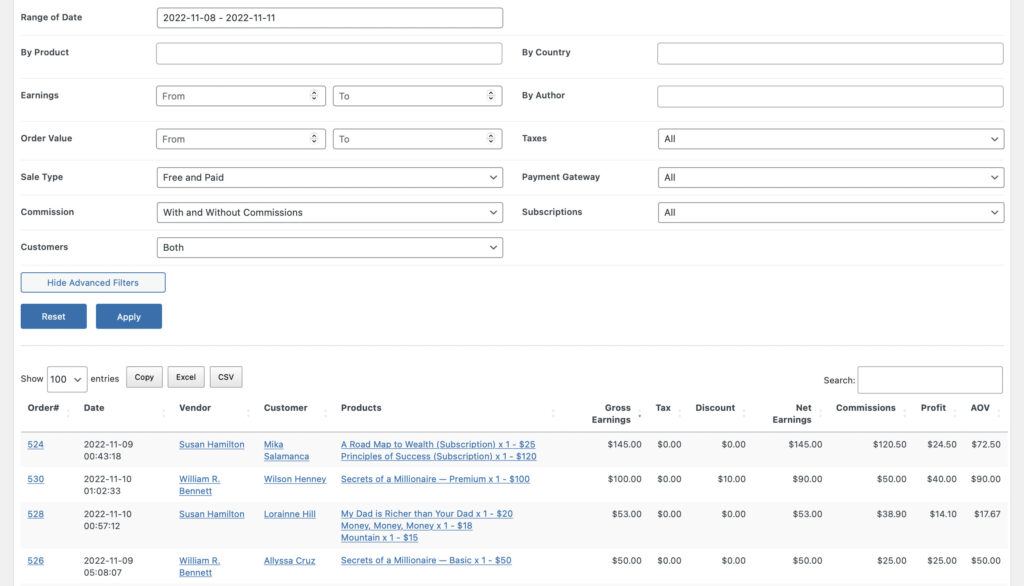
We also have comprehensive filter section which allow you to filter the reports by:
Range of Date
By Product
By Country
Earnings
By Author
Order Value
Taxes – with our without
Sales Type – Free, Paid or Free and Paid
Type of Payment Gateway
Subscriptions
Customers
Then lastly, down below the page you will see a list of all orders, including some information related to that specific order.
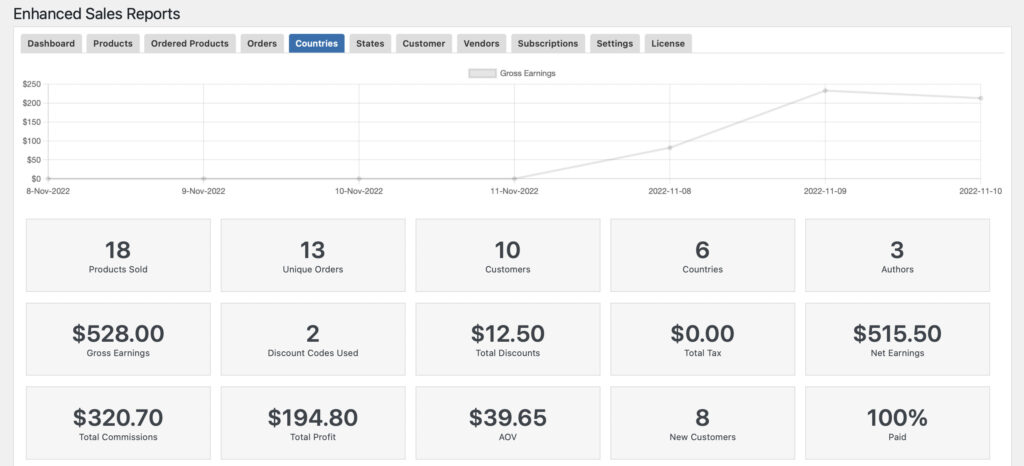
Report By Countries
The fourth report is the report by countries. Here, it summarizes the sales and profits per country from which the customer had made the purchase, in the selected time period and search filters.
Here we have a Gross Earnings Chart whichshows you the trend of sales revenues from the given time period.
Also included in the dashboard are the important KPIs such as:
Products Sold: Refers to the total number of products sold within the given time period.
Unique Orders: Refers to the total number of unique orders made within the given time frame.
Customers: Refers to the total number of customers transacted within your webstore.
Countries: Refers to the total number of countries in which your customers can from.
Authors: Refers to the total number of product authors of which their product is purchased by a customer.
Gross Earnings: Refers to the revenues for each product made during the selected time period.
Discount Codes Used: Refers to the total number of discount codes used by the customer when purchasing your products.
Total Discounts: Refers to the total amount of discounts used by the customers.
Total Tax: Refers to the total amount of tax accumulated and paid by customers.
Net Earnings: Refers to the net earnings, less discounts, tax and commissions, for each product made during the selected time period.
Total Commission: Refers to the total amount of vendor/author commissions accumulated during a customer purchase.
Total Profit: Refers to the total amount of profits from a customer purchase.
AOV: Refers to the average dollar amount spent each time a customer places an order on a website or mobile app.
New Customers #: Refers to the total number of new customers registered during the given time period.
Paid: Refers to the percentage of customer orders that has been successfully paid by customers during checkout.
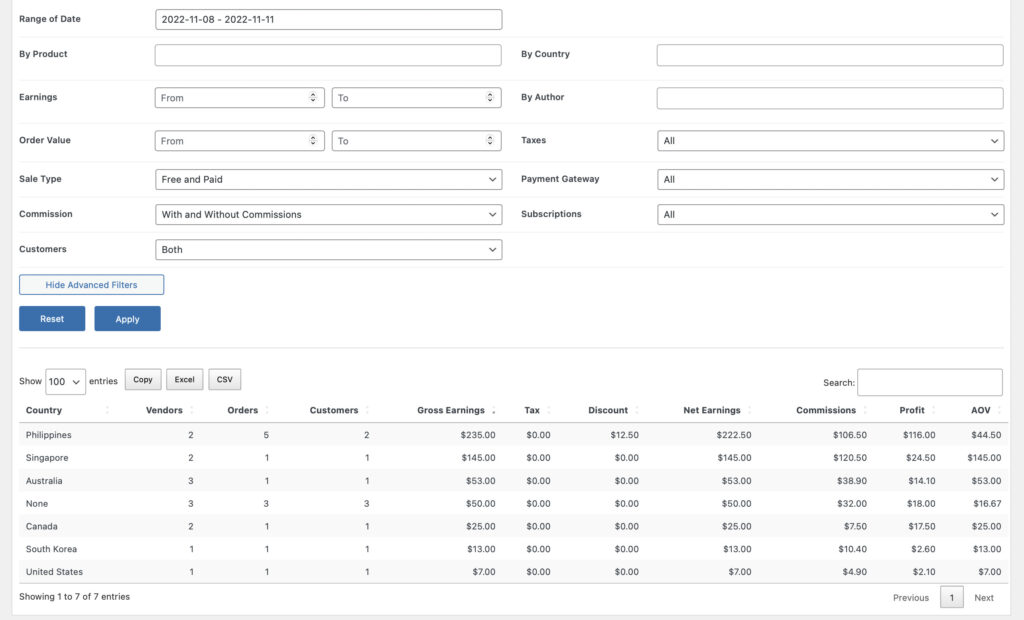
We also have comprehensive filter section which allow you to filter the reports by:
Range of Date
By Product
By Country
Earnings
By Author
Order Value
Taxes – with our without
Sales Type – Free, Paid or Free and Paid
Type of Payment Gateway
Subscriptions
Customers
Then lastly, down below the page you will see a list of all orders per country, including some sales information related to that country.
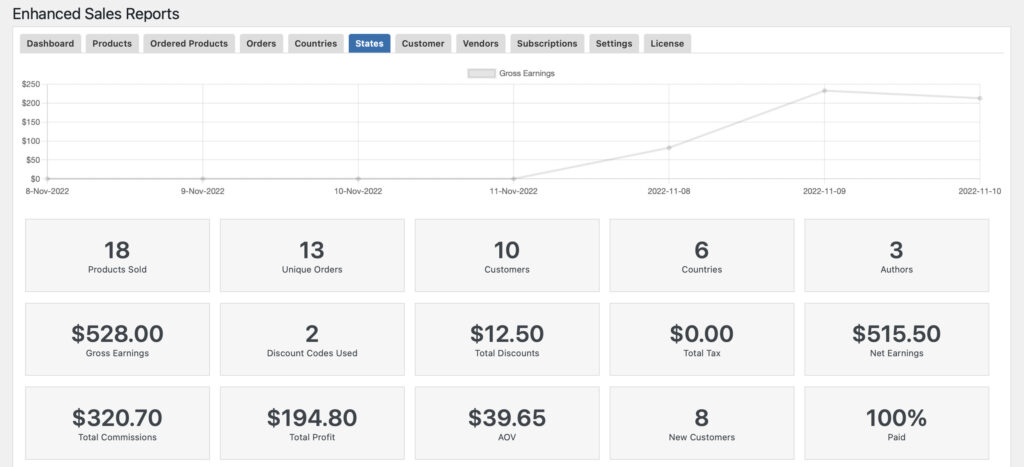
Report By States
The fifth report is the report by states. Here, it summarizes the sales and profits per states from which the customer had made the purchase, in the selected time period and search filters.
Here we have a Gross Earnings Chart whichshows you the trend of sales revenues from the given time period.
Also included in the dashboard are the important KPIs such as:
Products Sold: Refers to the total number of products sold within the given time period.
Unique Orders: Refers to the total number of unique orders made within the given time frame.
Customers: Refers to the total number of customers transacted within your webstore.
Countries: Refers to the total number of countries in which your customers can from.
Authors: Refers to the total number of product authors of which their product is purchased by a customer.
Gross Earnings: Refers to the revenues for each product made during the selected time period.
Discount Codes Used: Refers to the total number of discount codes used by the customer when purchasing your products.
Total Discounts: Refers to the total amount of discounts used by the customers.
Total Tax: Refers to the total amount of tax accumulated and paid by customers.
Net Earnings: Refers to the net earnings, less discounts, tax and commissions, for each product made during the selected time period.
Total Commission: Refers to the total amount of vendor/author commissions accumulated during a customer purchase.
Total Profit: Refers to the total amount of profits from a customer purchase.
AOV: Refers to the average dollar amount spent each time a customer places an order on a website or mobile app.
New Customers #: Refers to the total number of new customers registered during the given time period.
Paid: Refers to the percentage of customer orders that has been successfully paid by customers during checkout.
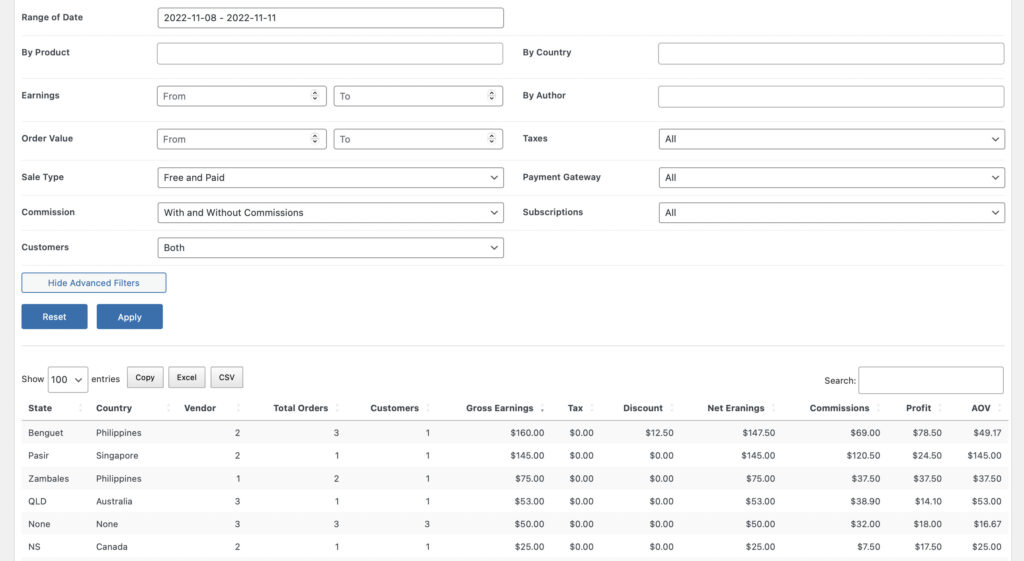
We also have comprehensive filter section which allow you to filter the reports by:
Range of Date
By Product
By Country
Earnings
By Author
Order Value
Taxes – with our without
Sales Type – Free, Paid or Free and Paid
Type of Payment Gateway
Subscriptions
Customers
Then lastly, down below the page you will see a list of all orders per states, including some sales information related to that state.
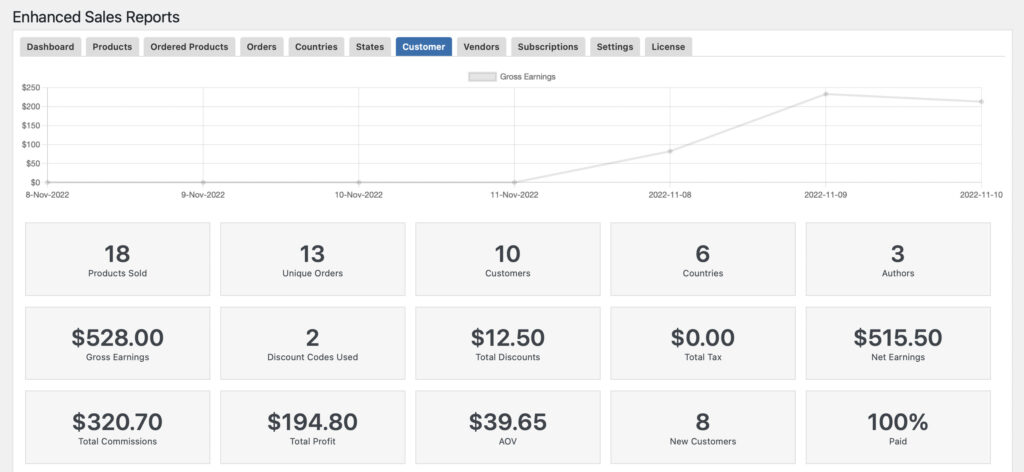
Report By Customer
The sixth report is the report by customer. Here, it summarizes the sales and profits per customer who transacted to your webstore, for the selected time period and search filters.
Here we have a Gross Earnings Chart whichshows you the trend of sales revenues from the given time period.
Also included in the dashboard are the important KPIs such as:
Products Sold: Refers to the total number of products sold within the given time period.
Unique Orders: Refers to the total number of unique orders made within the given time frame.
Customers: Refers to the total number of customers transacted within your webstore.
Countries: Refers to the total number of countries in which your customers can from.
Authors: Refers to the total number of product authors of which their product is purchased by a customer.
Gross Earnings: Refers to the revenues for each product made during the selected time period.
Discount Codes Used: Refers to the total number of discount codes used by the customer when purchasing your products.
Total Discounts: Refers to the total amount of discounts used by the customers.
Total Tax: Refers to the total amount of tax accumulated and paid by customers.
Net Earnings: Refers to the net earnings, less discounts, tax and commissions, for each product made during the selected time period.
Total Commission: Refers to the total amount of vendor/author commissions accumulated during a customer purchase.
Total Profit: Refers to the total amount of profits from a customer purchase.
AOV: Refers to the average dollar amount spent each time a customer places an order on a website or mobile app.
New Customers #: Refers to the total number of new customers registered during the given time period.
Paid: Refers to the percentage of customer orders that has been successfully paid by customers during checkout.
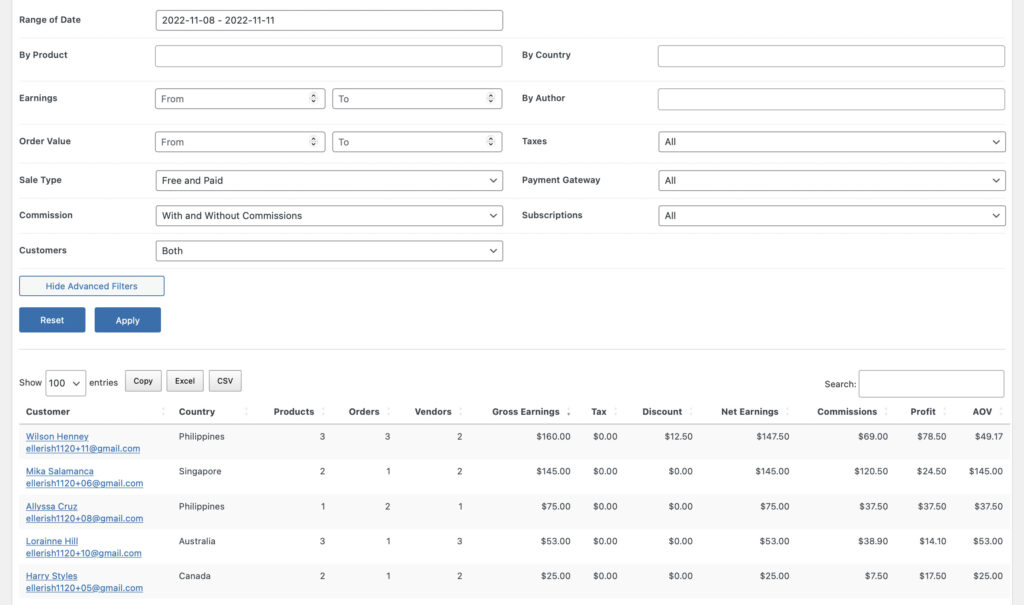
We also have comprehensive filter section which allow you to filter the reports by:
Range of Date
By Product
By Country
Earnings
By Author
Order Value
Taxes – with our without
Sales Type – Free, Paid or Free and Paid
Type of Payment Gateway
Subscriptions
Customers
Then lastly, down below the page you will see a list of all customers, including some information related to their orders.
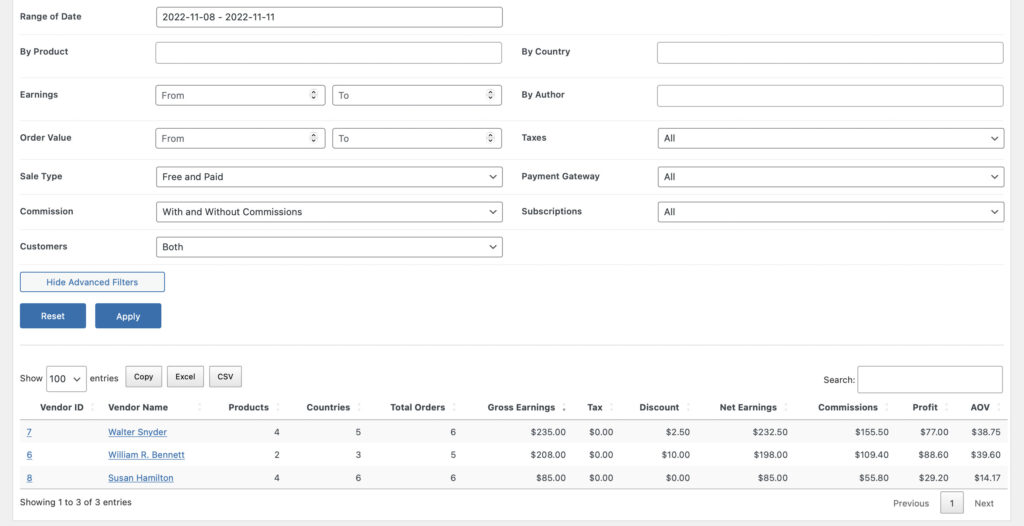
Report By Vendors
The seventh report is the report by vendor. Here, it summarizes the sales and profits made to the vendor’s products during for the selected time period and search filters.
Here we have a Gross Earnings Chart whichshows you the trend of sales revenues from the given time period.
Also included in the dashboard are the important KPIs such as:
Products Sold: Refers to the total number of products sold within the given time period.
Unique Orders: Refers to the total number of unique orders made within the given time frame.
Customers: Refers to the total number of customers transacted within your webstore.
Countries: Refers to the total number of countries in which your customers can from.
Authors: Refers to the total number of product authors of which their product is purchased by a customer.
Gross Earnings: Refers to the revenues for each product made during the selected time period.
Discount Codes Used: Refers to the total number of discount codes used by the customer when purchasing your products.
Total Discounts: Refers to the total amount of discounts used by the customers.
Total Tax: Refers to the total amount of tax accumulated and paid by customers.
Net Earnings: Refers to the net earnings, less discounts, tax and commissions, for each product made during the selected time period.
Total Commission: Refers to the total amount of vendor/author commissions accumulated during a customer purchase.
Total Profit: Refers to the total amount of profits from a customer purchase.
AOV: Refers to the average dollar amount spent each time a customer places an order on a website or mobile app.
New Customers #: Refers to the total number of new customers registered during the given time period.
Paid: Refers to the percentage of customer orders that has been successfully paid by customers during checkout.
We also have comprehensive filter section which allow you to filter the reports by:
Range of Date
By Product
By Country
Earnings
By Author
Order Value
Taxes – with our without
Sales Type – Free, Paid or Free and Paid
Type of Payment Gateway
Subscriptions
Customers
Then lastly, down below the page you will see a list of all vendors, including some information related to the purchases made on their products.
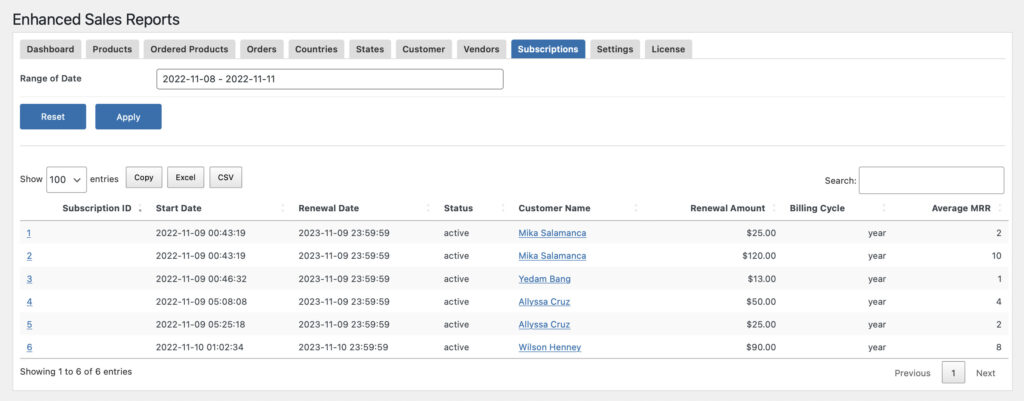
Report By Subscriptions
The last report is the report by subscriptions. This is most important for digital webstore owners selling subscriptions as monitoring this is vital for the overall webstore. Here, it summarizes the sales and profits per subscription purchase made on the webstore for the selected time period and search filters.
Here we have a Gross Earnings Chart whichshows you the trend of sales revenues from the given time period.
Also included in the dashboard are the important KPIs such as:
Products Sold: Refers to the total number of products sold within the given time period.
Unique Orders: Refers to the total number of unique orders made within the given time frame.
Customers: Refers to the total number of customers transacted within your webstore.
Countries: Refers to the total number of countries in which your customers can from.
Authors: Refers to the total number of product authors of which their product is purchased by a customer.
Gross Earnings: Refers to the revenues for each product made during the selected time period.
Discount Codes Used: Refers to the total number of discount codes used by the customer when purchasing your products.
Total Discounts: Refers to the total amount of discounts used by the customers.
Total Tax: Refers to the total amount of tax accumulated and paid by customers.
Net Earnings: Refers to the net earnings, less discounts, tax and commissions, for each product made during the selected time period.
Total Commission: Refers to the total amount of vendor/author commissions accumulated during a customer purchase.
Total Profit: Refers to the total amount of profits from a customer purchase.
AOV: Refers to the average dollar amount spent each time a customer places an order on a website or mobile app.
New Customers #: Refers to the total number of new customers registered during the given time period.
Paid: Refers to the percentage of customer orders that has been successfully paid by customers during checkout.
We also have comprehensive filter section which allow you to filter the reports by:
Range of Date
By Product
By Country
Earnings
By Author
Order Value
Taxes – with our without
Sales Type – Free, Paid or Free and Paid
Type of Payment Gateway
Subscriptions
Customers
Then lastly, down below the page you will see a list of all customer subscriptions, including some information related to that order.
Download your Data via Excel, CSV, Copy/Paste
For downloading the report data, we have included options that will allow you to download the reports as Excel, CSV files, or have them copied directly in your memory/clipboard. This is especially useful if you wish to process your data further in a spreadsheet program. If you refer to the screenshot above, you can see the Download buttons right next to the Column Visibility button.
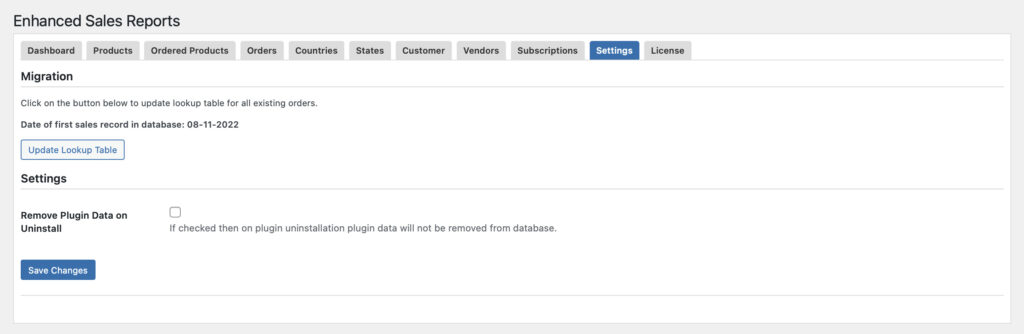
Settings
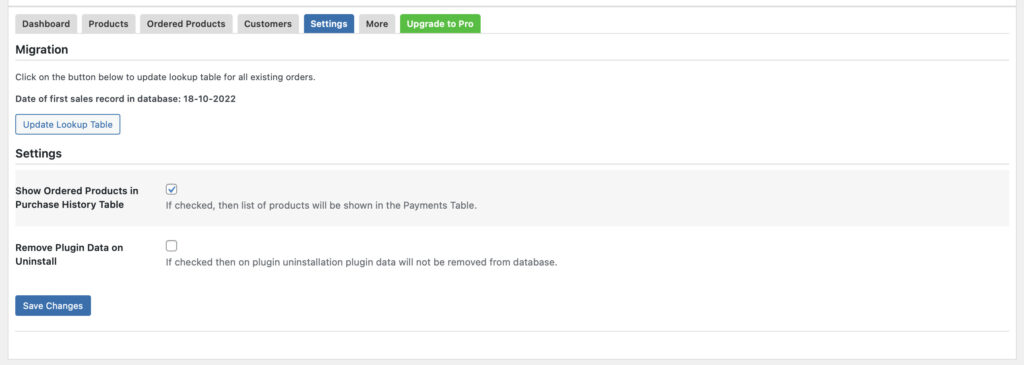
Here some few general settings for the plugin:
Migration – You can click the “Update Lookup Table” to update lookup table for all existing orders.
Remove Plugin Data on Uninstall – Enable/Disable
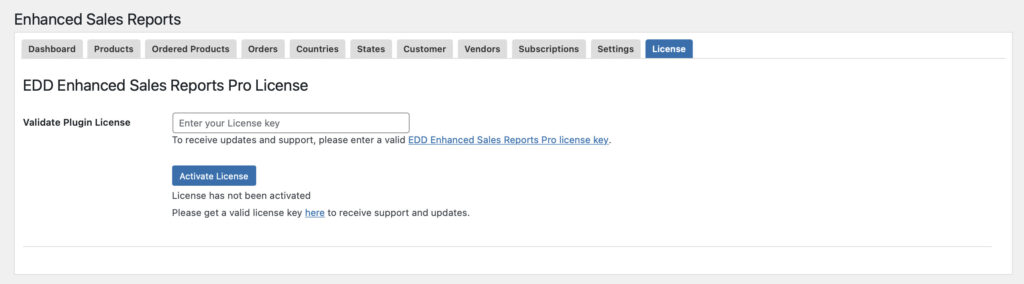
License
In order to receive support and updates, you need to enter here your valid license for our EDD Enhanced Sales Reports Pro Plugin.
In conclusion, we hope that this documentation was useful to you. If you have any questions regarding this plugin or other plugins you have in mind, kindly drop us a comment below or simply contact us.